আরও দেখুন

 09.12.2025 03:00 AM
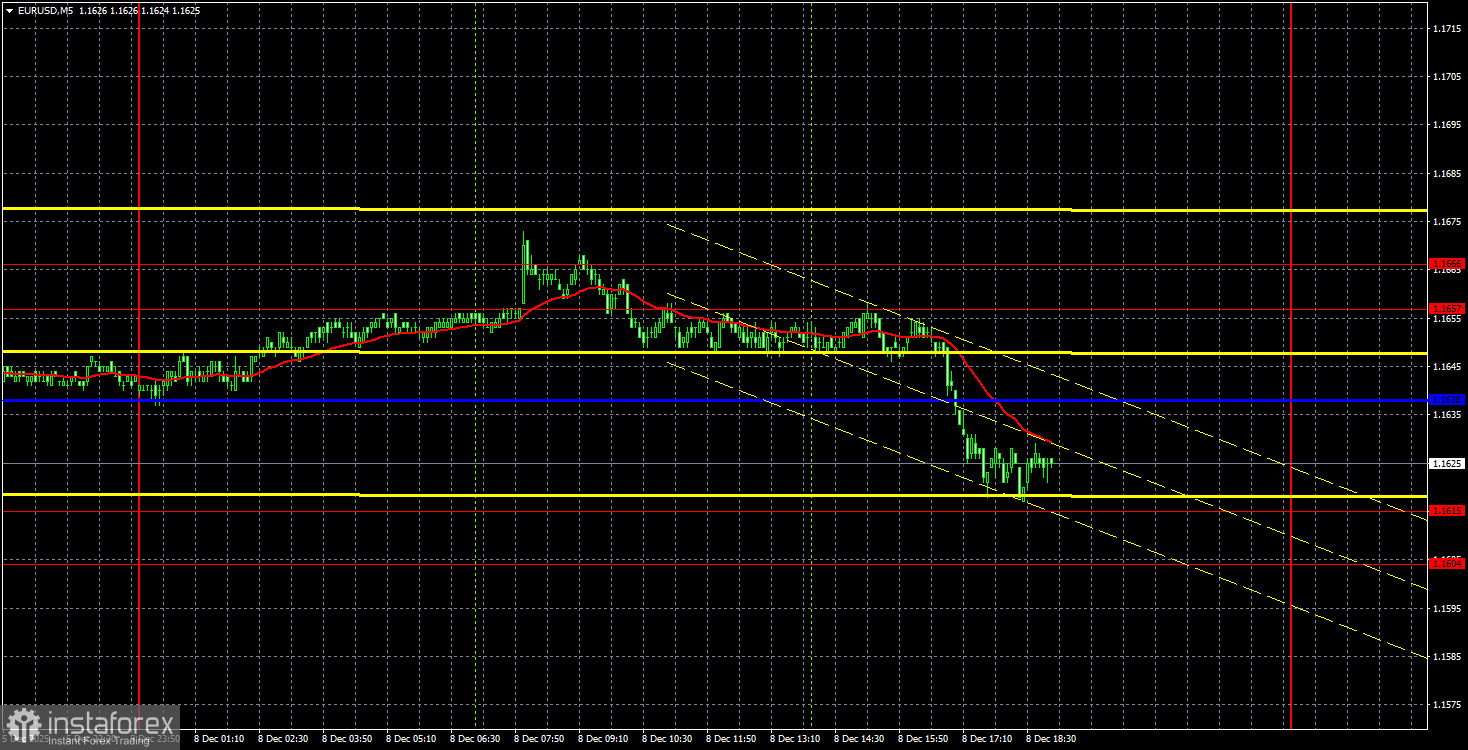
The EUR/USD currency pair fell on Monday. This is yet another instance highlighting "How logically the market is trading right now." On Monday, the only macroeconomic report of the day was Germany's industrial production, which finally beat expectations, posting solid month-on-month growth of 1.8%. However, traders did not react to this report during either the European or American trading sessions. Instead, in the afternoon, the pair began to fall, while GBP/USD remained stable and traded with even lower volatility. Overall, movements continue to stay outside the thresholds of this pathetic three-dimensional universe.
As a result of the price decline on Monday, the pair dropped below the critical Kijun-sen line and below the trend line. Thus, the upward trend ended once again without really beginning. Recall that the Federal Reserve meeting will take place on Wednesday, where a decision to cut the key rate is almost certain. Once again, the dollar responded with growth to the Fed's monetary policy easing. We would not rush to conclude that the upward trend has ended, as the price still needs to overcome the area of 1.1604-1.1615, the Senkou Span B line. However, recent movements have been very weak.
On the 5-minute timeframe on Monday, signals formed that had no real trading value. The price rebounded from the area of 1.1657-1.1666, but 20 pips lower lay the Kijun-sen line. The price established itself below Kijun-sen, but 20 pips below was the region of 1.1604-1.1615.
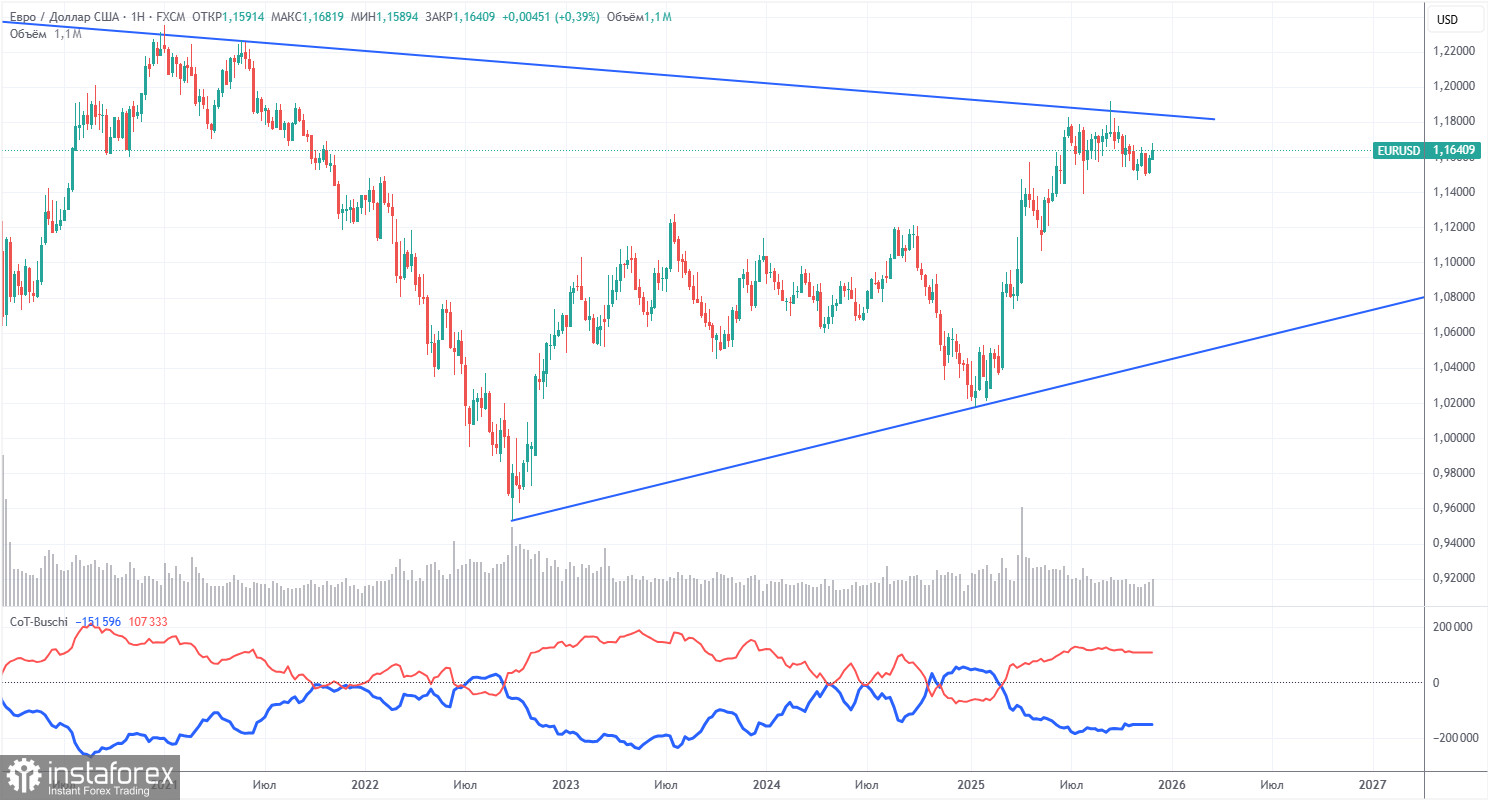
The last COT report was released last week and is dated October 28. In other words, it is, to put it mildly, outdated. The illustration above shows that the net position of non-commercial traders has been "bullish" for a long time, and that bears struggled to gain a foothold in the lead at the end of 2024 but lost it very quickly. Since Trump took office as President of the United States for the second time, the dollar has only been falling. We cannot say with 100% certainty that the decline of the American currency will continue, but current global developments suggest this scenario is indeed possible.
We still do not see any fundamental factors supporting the strengthening of the euro, yet there are plenty of factors suggesting a decline for the dollar. The global downward trend remains intact, but what matters now is not where the price has moved in the last 17 years. The dollar may begin to rise if the global fundamental picture changes, but currently, there are no signs of this.
The positioning of the red and blue lines of the indicator continues to indicate the maintenance of a "bullish" trend. Over the last reporting week, the number of longs for the "Non-commercial" group increased by 5,900, while shorts increased by 10,300. Consequently, the net position decreased by 4,400 contracts over the week. However, this data is already outdated and holds no significance.
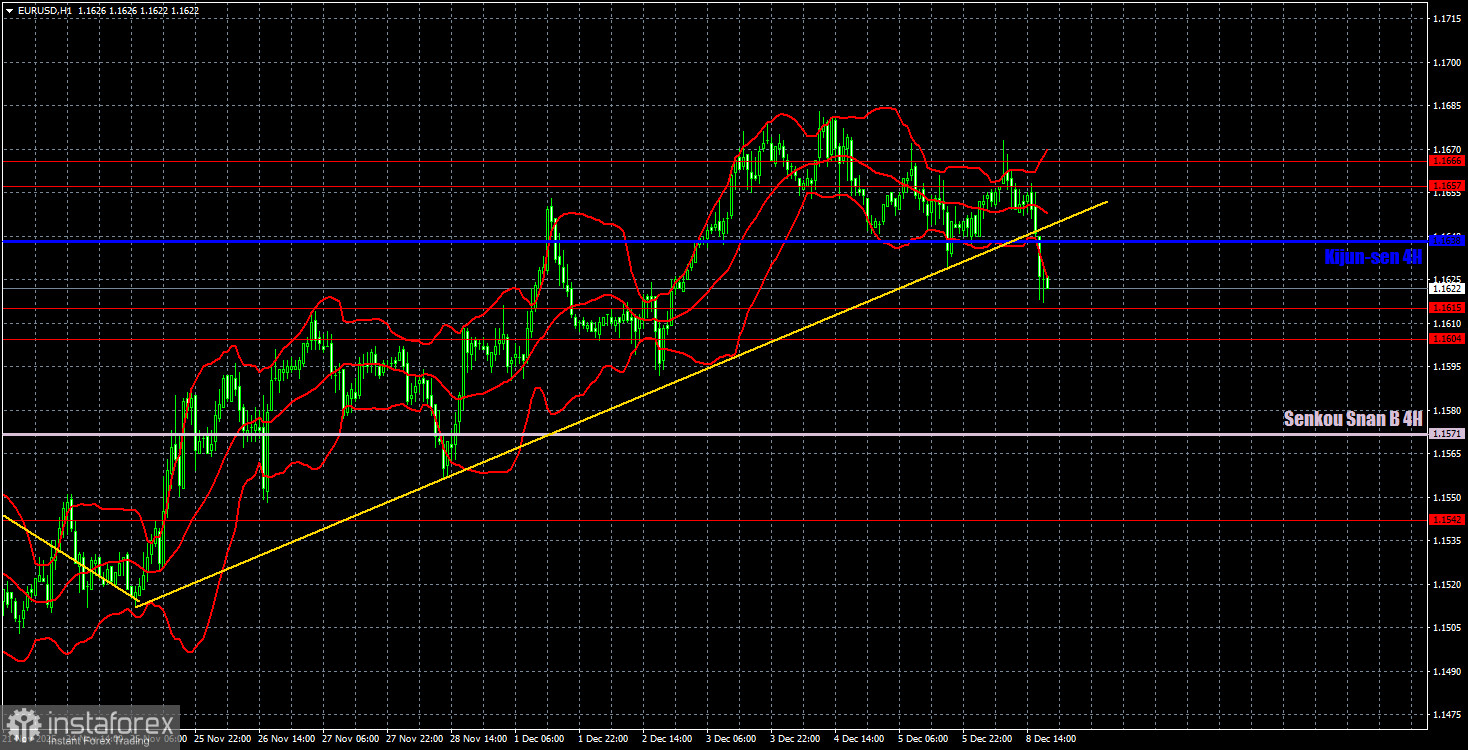
On the hourly timeframe, the EUR/USD pair may have completed another upward trend, but we would not make such a conclusion given the character of the pair's movements in recent months until it establishes itself below the Senkou Span B line. The price remains within a sideways channel of 1.1400-1.1830 on the daily timeframe; therefore, we can still expect the euro to strengthen towards 1.1800 in the near future. The rise of the euro is extremely weak, but movements within a flat are always weak and chaotic.
For December 9, we highlight the following levels for trading: 1.1234, 1.1274, 1.1362, 1.1426, 1.1542, 1.1604-1.1615, 1.1657-1.1666, 1.1750-1.1760, 1.1846-1.1857, 1.1922, 1.1971-1.1988, as well as the Senkou Span B line (1.1571) and Kijun-sen line (1.1638). The lines of the Ichimoku indicator may shift during the day, which should be taken into account when determining trading signals. Remember to set Stop Loss orders to break even if the price moves in the correct direction by 15 pips. This will protect against potential losses if the signal turns out to be false.
On Tuesday, there are no significant events or reports planned in the Eurozone, while in the United States, relatively important JOLTS and ADP reports will be released. The problem with these reports is that ADP is weekly rather than monthly, and JOLTS covers September and October.
On Tuesday, traders may again trade from the area of 1.1604-1.1615. However, above this area lies the Kijun-sen line, and below it is Senkou Span B. We recommend waiting for signals to form when the target is not within 20 pips.


