یہ بھی دیکھیں

 04.03.2026 01:05 PM
Trade Review and Advice on Trading the Japanese Yen
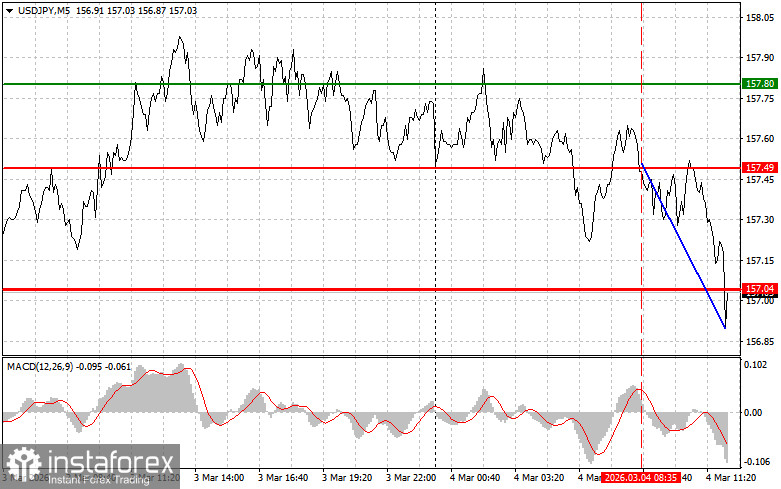
The test of the 157.49 price level occurred when the MACD indicator had just begun moving downward from the zero line, confirming a proper entry point for selling the dollar. As a result, the pair declined toward the target level of 157.04.
Next, important statistics are expected to be released: February U.S. ADP employment change data and the ISM Services PMI. These indicators are crucial for shaping expectations regarding future Federal Reserve monetary policy. A positive trend in the ADP report may signal continued resilience in the labor market, increasing the likelihood that the Fed will maintain a tight policy stance and potentially triggering a new wave of dollar growth.
As for the ISM Services PMI, a reading above 50 indicates expansion in the sector, while a drop below that mark points to contraction. Market participants will analyze not only the headline figure but also its components, particularly the employment and new orders sub-indices, which help forecast further developments.
Regarding the intraday strategy, I will primarily rely on the implementation of Scenarios No. 1 and No. 2.
Buy Signal
Scenario No. 1: Today, I plan to buy USD/JPY at the entry point around 157.19 (green line on the chart), with a target of 157.60 (thicker green line on the chart). Around 157.60, I will exit long positions and open short positions in the opposite direction (aiming for a 30–35 point move from that level). Growth in the pair can be expected today after strong data.Important: Before buying, make sure the MACD indicator is above the zero line and just beginning to rise from it.
Scenario No. 2: I also plan to buy USD/JPY if there are two consecutive tests of the 156.83 level while the MACD indicator is in the oversold area. This will limit the pair's downward potential and lead to an upward market reversal. Growth toward the opposite levels of 157.19 and 157.60 can then be expected.
Sell Signal
Scenario No. 1: I plan to sell USD/JPY after a break below the 156.83 level (red line on the chart), which may lead to a rapid decline in the pair. The key target for sellers will be 156.56, where I will exit short positions and immediately open long positions in the opposite direction (aiming for a 20–25 point move from that level). Pressure on the pair will return in the event of weak reports.Important: Before selling, make sure the MACD indicator is below the zero line and just beginning to decline from it.
Scenario No. 2: I also plan to sell USD/JPY if there are two consecutive tests of the 157.19 level while the MACD indicator is in the overbought area. This will limit the pair's upward potential and lead to a downward market reversal. A decline toward the opposite levels of 156.83 and 156.56 can then be expected.
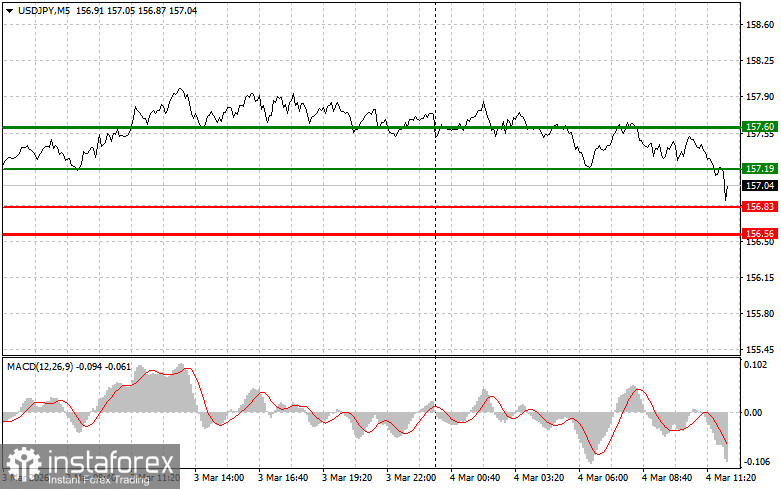
Chart Explanation
Important
Beginner Forex traders should make market entry decisions very carefully. Before the release of important fundamental reports, it is best to stay out of the market to avoid sharp price fluctuations. If you decide to trade during news releases, always place stop-loss orders to minimize losses. Without stop-loss orders, you can quickly lose your entire deposit, especially if you do not use proper money management and trade large volumes.
Remember, successful trading requires a clear trading plan, like the one outlined above. Spontaneous trading decisions based solely on the current market situation are inherently a losing strategy for an intraday trader.


