یہ بھی دیکھیں

 10.04.2026 04:08 AM
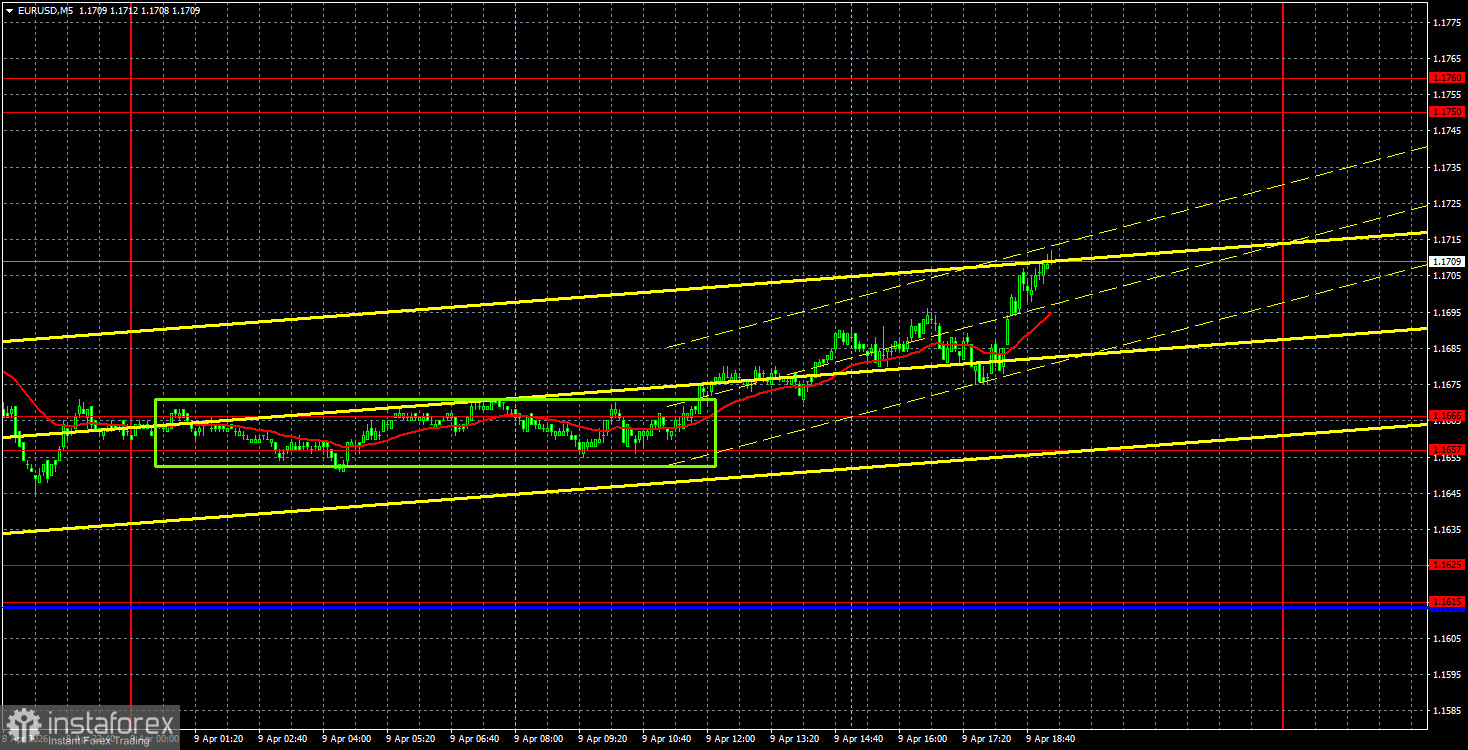
The EUR/USD currency pair resumed its upward movement on Thursday, though the market move was rather unclear. Recall that the ceasefire between Iran, the U.S., and Israel did not last even a day. By Wednesday afternoon, Israel had attacked Lebanon, Iran had struck Bahrain and Kuwait, and the U.S. also launched strikes on oil refineries in Iran. It seemed like the best scenario for the U.S. dollar could not be imagined. However, this time, the market ignored the resurgence of hostilities in the Middle East. The only explanation is that the market believes the war is now temporary. Negotiations between Iran and the U.S. continue and have a chance of long-term success. Therefore, the dollar continues to weaken amid decreasing tensions in the Middle East, even though the Strait of Hormuz remains blocked.
It is also important to note the GDP report in the third estimate for the fourth quarter in the U.S. Recall that the first estimate was 1.4%, the second was 0.7%, and the third came in at a mere 0.5%. Thus, the American economy slowed three times in the same quarter. Naturally, this report did not boost the sentiment of dollar buyers, but we do not believe it was fully factored in by traders. The market has ignored almost all macroeconomic data over the past two months.
On the 5-minute time frame on Thursday, exactly one trading signal was formed. During the European trading session, the pair bounced off the area of 1.1657-1.1666 and moved only upward for the remaining part of the day. As a result, traders who opened long positions could earn around 35-40 pips.
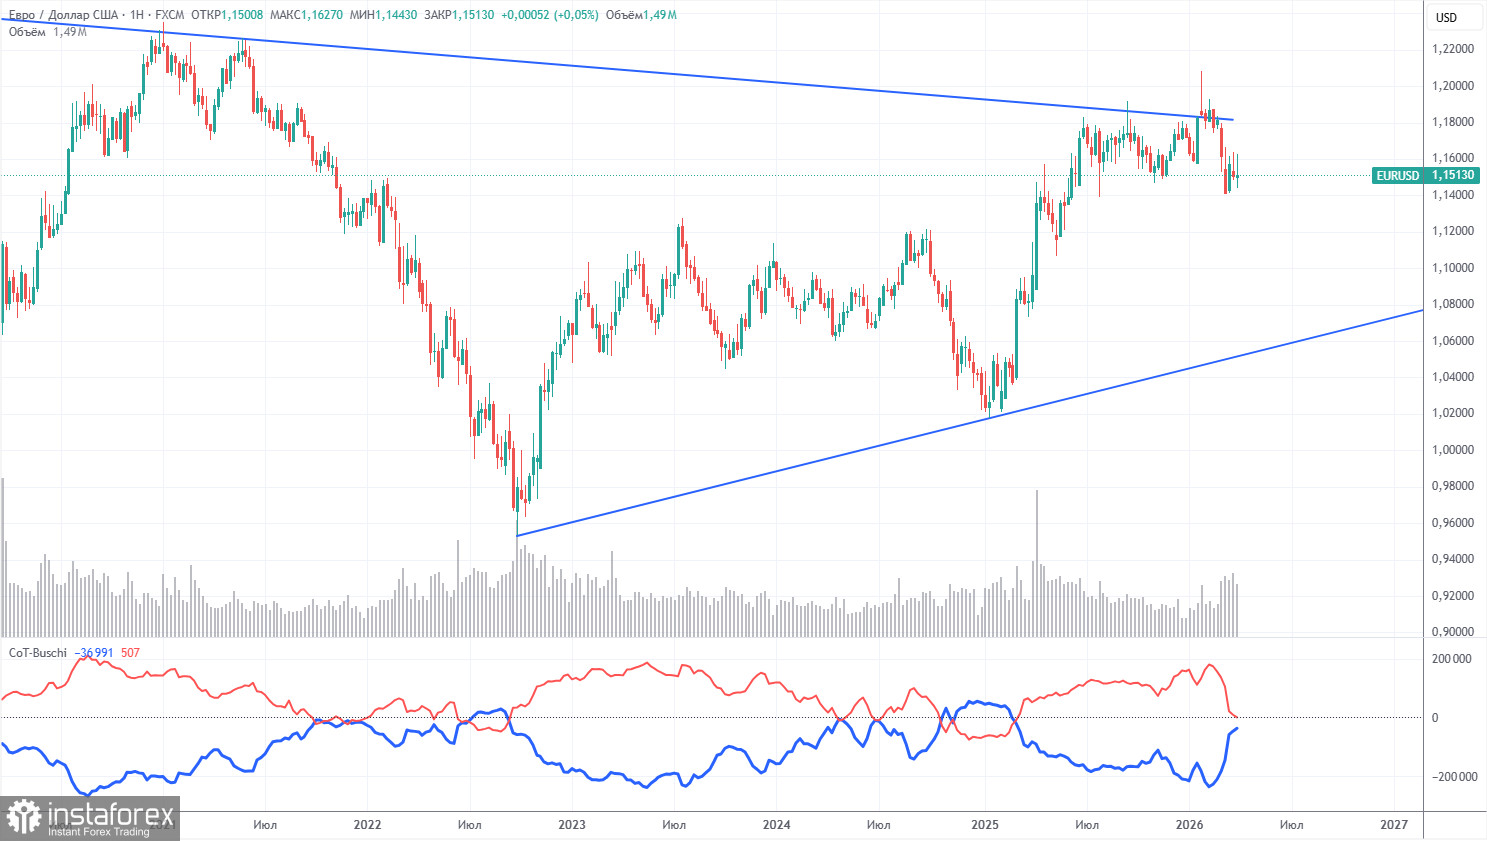
The latest COT report is dated March 31. The illustration of the weekly time frame clearly shows that the net position of non-commercial traders remains "bullish," but is rapidly declining amid geopolitical events. Traders are mass-selling the euro in favor of the U.S. dollar. Trump's policies have not changed, but the dollar is once again acting as a "reserve currency," which ensures high demand for it.
We still do not see any fundamental factors supporting a strengthening of the euro. However, there are plenty of factors that could lead to the decline of the American dollar. The war in the Middle East has temporarily made the dollar super attractive, but once this factor expires, everything could revert to the previous state. In the long term, the euro could fall to as low as 1.06 (the trend line), but the upward trend will still remain relevant.
The positioning of the red and blue lines of the indicator continues to indicate the maintenance of a "bullish" trend. Over the last reporting week, the number of long positions in the "Non-commercial" group increased by 100, while the number of shorts increased by 8,900. Consequently, the net position has decreased by another 8,800 contracts over the week.
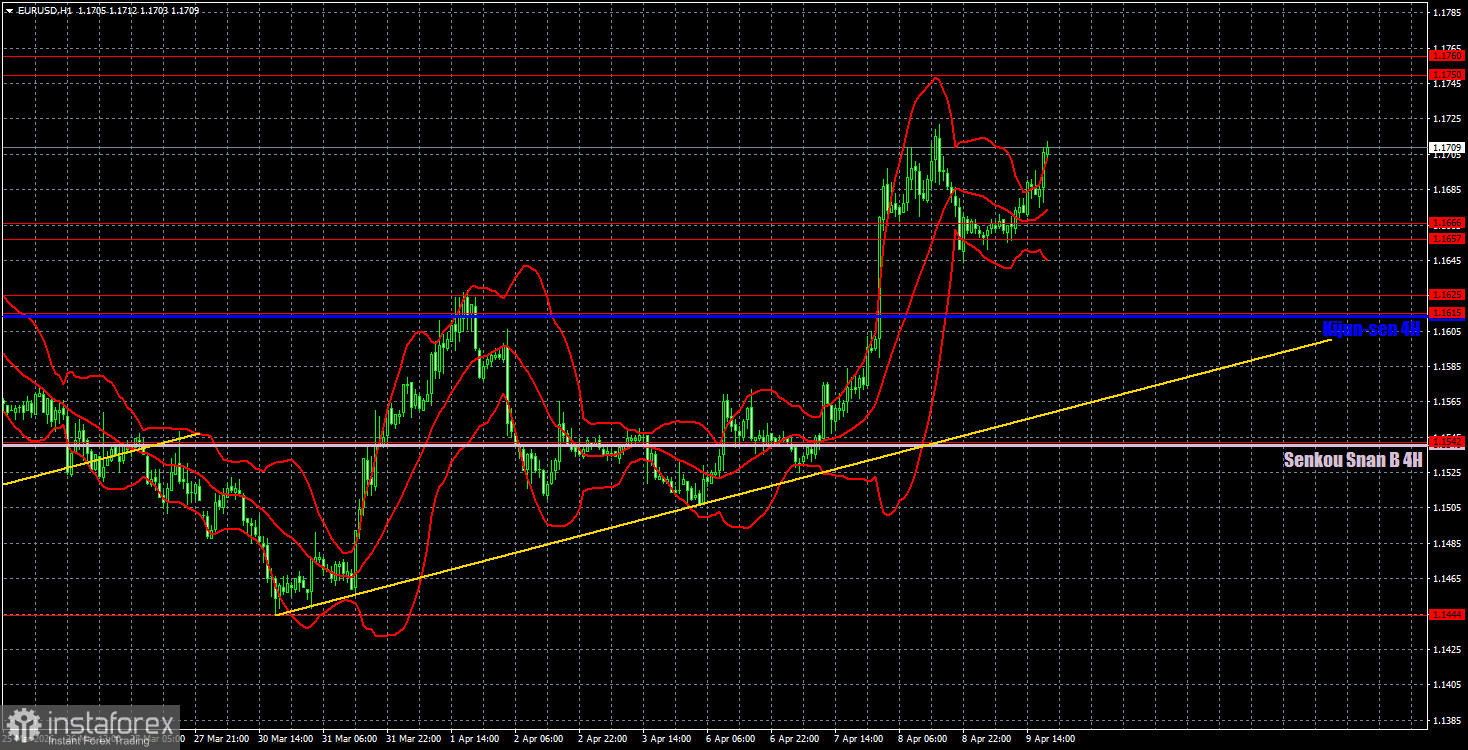
On the hourly time frame, the EUR/USD pair has begun a new upward trend. However, a new escalation in the Middle East could once again shift traders' trading priorities, so any rise should be approached with caution. In the near future, we need to determine whether a ceasefire exists, whether further negotiations will take place between the parties, and how successful they may be. This will affect the dynamics of the EUR/USD pair.
For April 10, we highlight the following levels for trading: 1.1234, 1.1274, 1.1362, 1.1426, 1.1542, 1.1615-1.1625, 1.1657-1.1666, 1.1750-1.1760, 1.1830-1.1837, as well as the Senkou Span B line (1.1542) and Kijun-sen line (1.1614). The Ichimoku indicator lines may shift during the day, which should be taken into account when determining trading signals. Don't forget to set a stop-loss order to breakeven if the price moves in the right direction by 15 pips. This will help safeguard against potential losses if the signal turns out to be false.
On Friday, Germany will publish the second estimate of March inflation, while the U.S. will release March inflation data and the University of Michigan consumer sentiment index. We believe traders may react only to the U.S. consumer price index, and even then, it's not guaranteed. Geopolitics remains the primary concern for traders in terms of importance.
On Friday, traders may consider short positions if the price bounces from the 1.1750-1.1760 area, targeting 1.1657-1.1666. Long positions can be held with a target of 1.1750-1.1760, as the price has rebounded from the 1.1657-1.1666 area.


