Veja também

 16.04.2026 03:58 AM
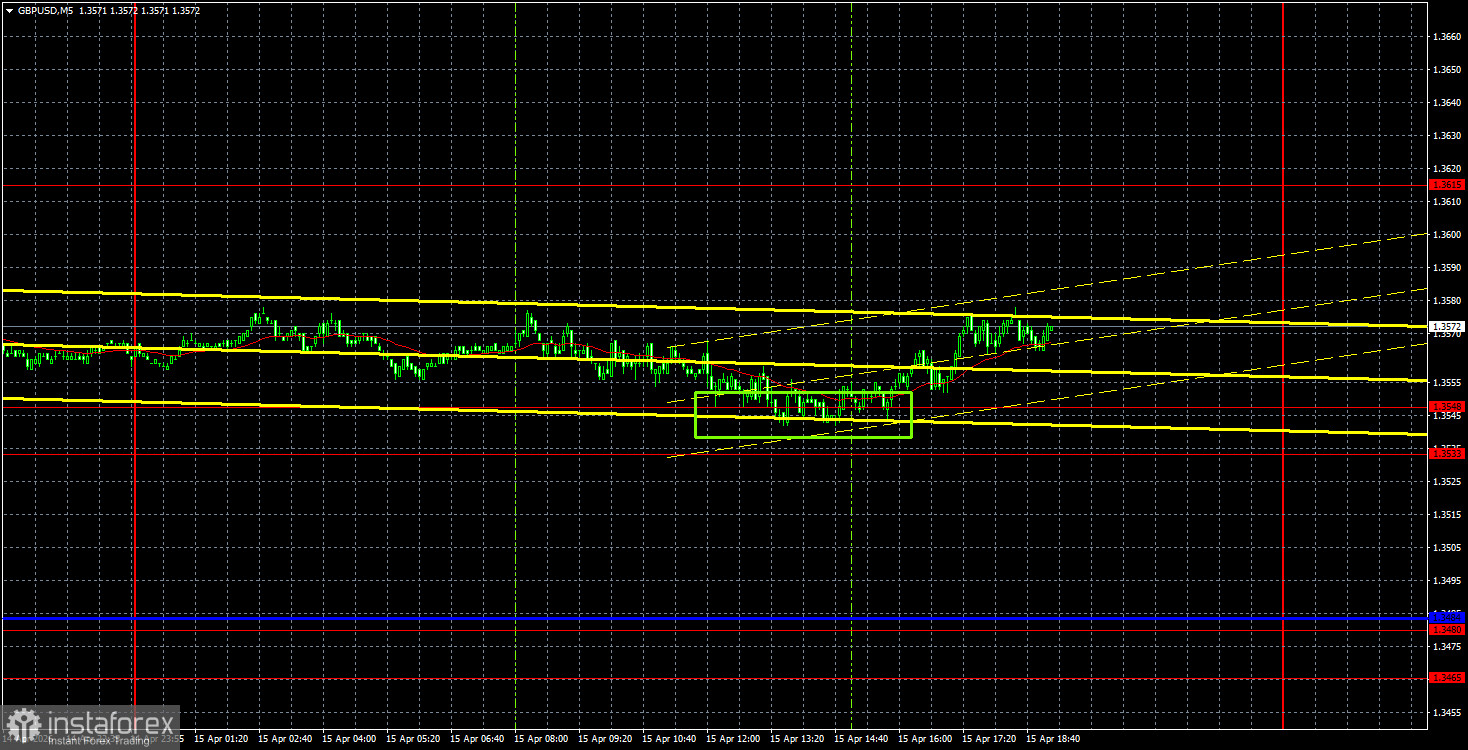
The GBP/USD currency pair minimally corrected towards the nearest support area on Wednesday. There were no significant macroeconomic or fundamental events throughout the day, and no geopolitical news was reported. Andrew Bailey's speech took place late in the evening and could not influence trading during the day. As a result, the market found no reason to buy or sell. The rebound from the 1.3533-1.3548 area raises the likelihood of continued growth on Thursday and Friday. Overall, the British currency is continuing its recovery after two months of declines, for any reason. During this timeframe, the market focused solely on geopolitics, which is why only the "safe" dollar appreciated. Once this factor weakened, the dollar began depreciating immediately, and it has been declining almost every day for the past week and a half.
From a technical perspective, the upward trend is undeniable. The market has stopped paying attention to all secondary news related to the Middle East. Therefore, the market's reaction to geopolitics can now be expected only for genuinely important news. There is none at this time. A second round of negotiations between the U.S. and Iran may take place today. We are quite skeptical about this, but the situation in the Middle East may change. The most important thing for the entire world right now is to reopen the Strait of Hormuz.
On the 5-minute timeframe, one trading signal was formed on Wednesday, which essentially duplicated a similar buy signal from Tuesday. The price rebounded from the 1.3533-1.3548 area, allowing traders to open new long positions. Long positions can be held with the target of 1.3615 until there is a consolidation below the specified area.
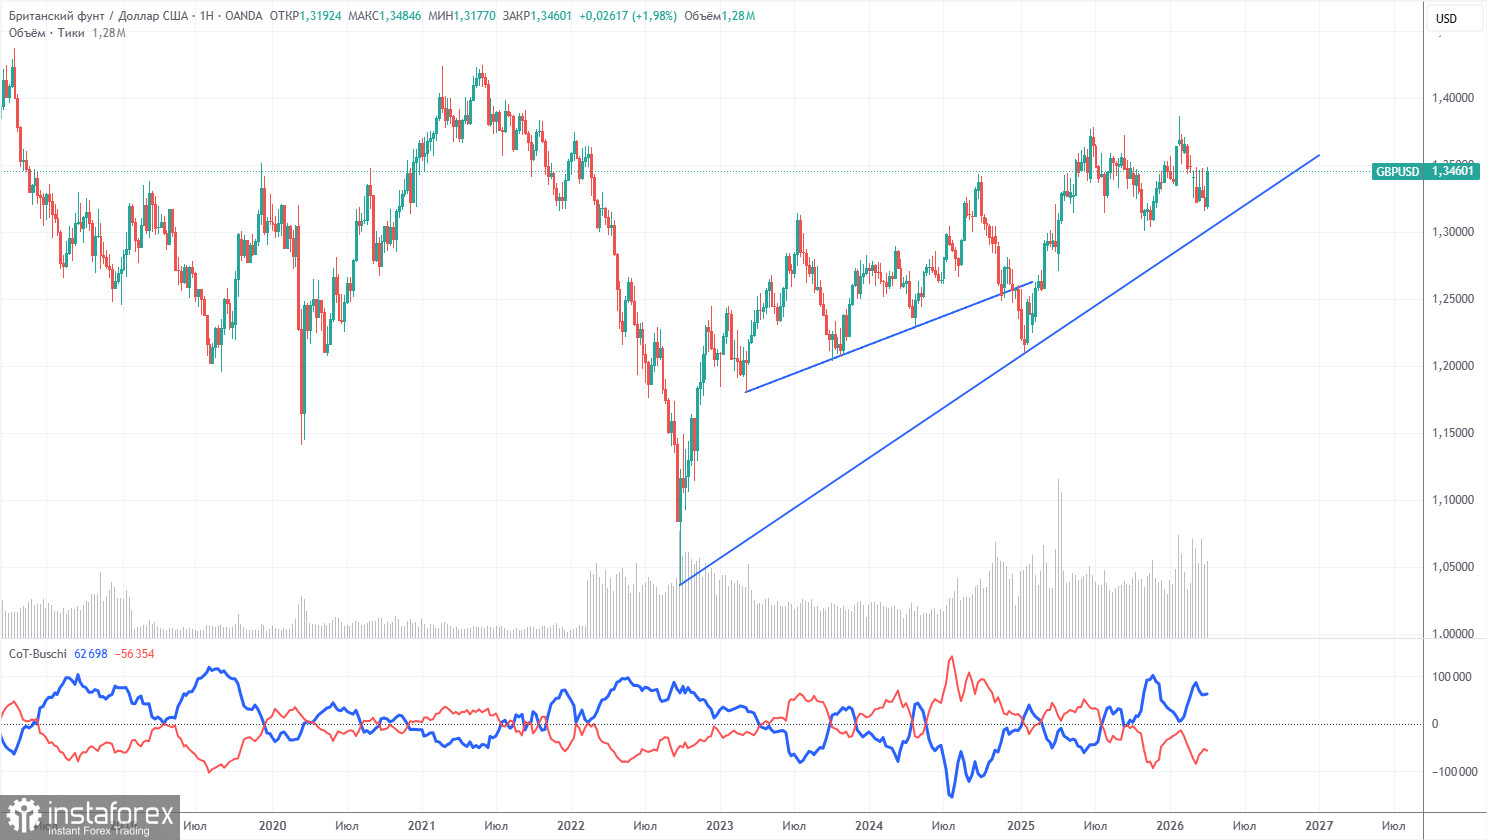
The COT reports for the British pound show that, in recent years, commercial traders' sentiment has been constantly changing. The red and blue lines representing the net positions of commercial and non-commercial traders frequently cross each other and are usually close to the zero mark. Currently, the lines are diverging, with non-commercial traders still dominating with... sell positions. However, given the events in the Middle East, it is not surprising that demand for riskier currencies is falling while demand for the dollar is rising.
In the long term, the dollar continues to decline due to Donald Trump's policies, as shown on the weekly timeframe (illustration above). The trade war will continue in one form or another for a long time, but geopolitical factors currently take precedence, providing strong support to the US dollar. According to the latest COT report (from April 7), the "Non-commercial" group closed 3,900 buy contracts and 300 sell contracts. Thus, the net position of non-commercial traders decreased by 3,600 contracts over the week.
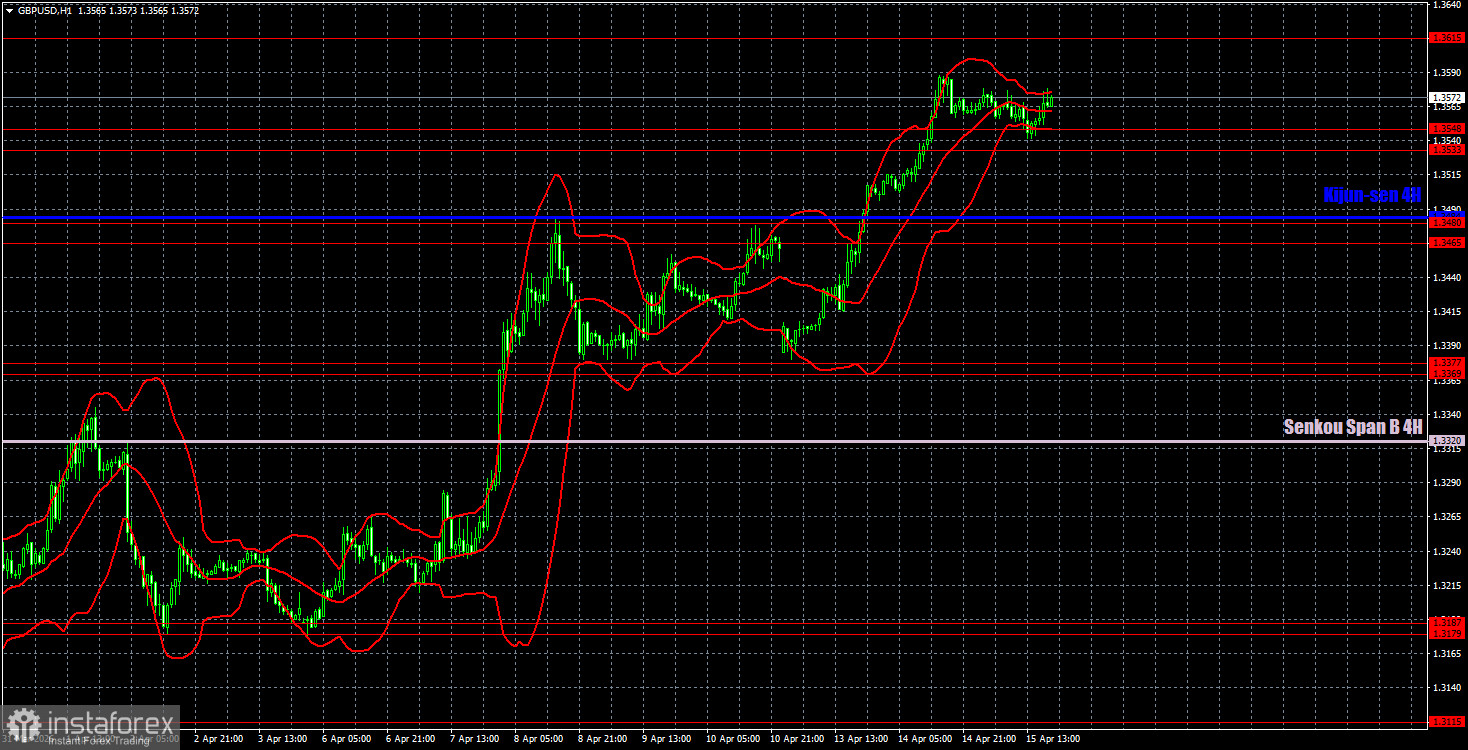
On the hourly timeframe, the GBP/USD pair continues to form an upward trend, which could be nullified if a full-scale war resumes in the Middle East. It should also be noted that the influence of geopolitics is weakening, as indicated by this week's movements; however, military actions in the region remain on hold. The Strait of Hormuz remains blocked, but new peace negotiations between Washington and Tehran may begin this week.
For April 16, we highlight the following important levels: 1.3096-1.3115, 1.3179-1.3187, 1.3369-1.3377, 1.3465-1.3480, 1.3533-1.3548, 1.3615, 1.3671-1.3681, 1.3751-1.3763. The Senkou Span B line (1.3320) and Kijun-sen line (1.3484) may also serve as sources of signals. It is recommended to set the stop-loss order to breakeven after the price has moved in the right direction by 20 pips. The Ichimoku indicator lines may shift throughout the day, which should be taken into account when determining trading signals.
On Thursday, the UK will publish its monthly GDP and industrial production reports. Over the past two months, the market has largely ignored numerous more important reports and events. Therefore, it is unlikely we will see a market reaction to these two reports this morning. In the U.S., the reports will be even less significant: industrial production and jobless claims.
Today, traders may consider short positions targeting 1.3465-1.3480 if the price consolidates below the 1.3533-1.3548 area or rebounds from 1.3615. Long positions can be maintained with targets at 1.3615 and 1.3671-1.3681 if the price remains above the 1.3533-1.3548 area.
Support and resistance price levels are thick red lines around which the movement may end. They are not sources of trading signals.
The Kijun-sen and Senkou Span B lines are lines of the Ichimoku indicator, transferred to the hourly timeframe from the 4-hour timeframe. They are strong lines.
Extreme levels are thin red lines from which the price previously rebounded. They are sources of trading signals.
Yellow lines are trend lines, trend channels, and any other technical patterns.
Indicator 1 on the COT charts shows the size of the net position of each category of traders.


