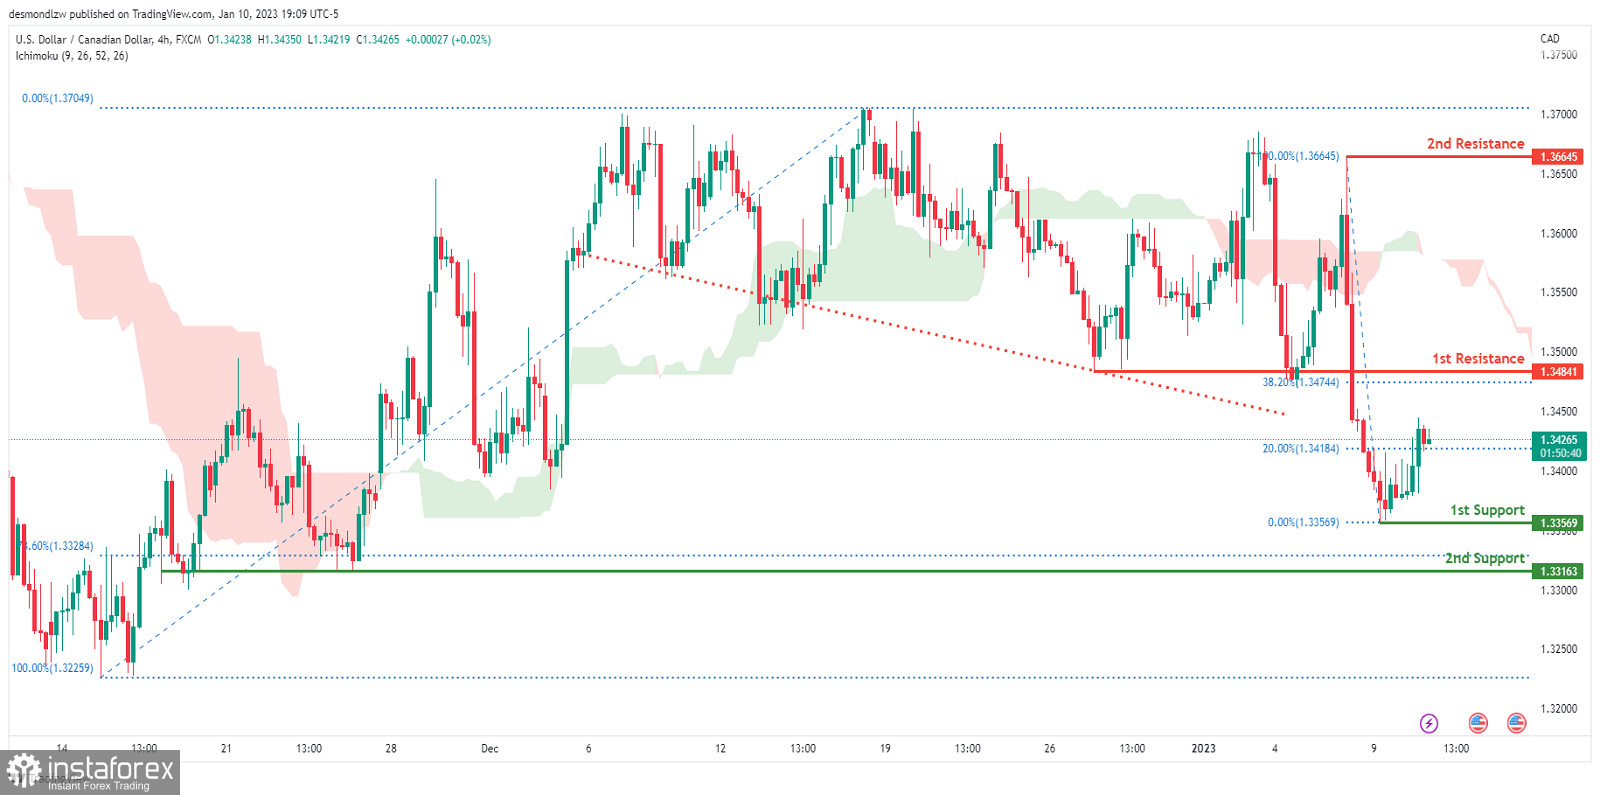
On the H4 chart, the overall bias for USDCAD is bearish. To add confluence to this, the price is below the Ichimoku cloud which indicates a bearish market. To add support to this bias, price has also broken under the descending trendline indicating strong bearish momentum. If this bearish momentum continues, expect the price to possibly head towards the 1st support at 1.33569, where the recent low is. In an alternative scenario, price could head back up to retest the 1st resistance at 1.34841, where the 38.2% Fibonacci line is.

 11.01.2023 12:02 PM