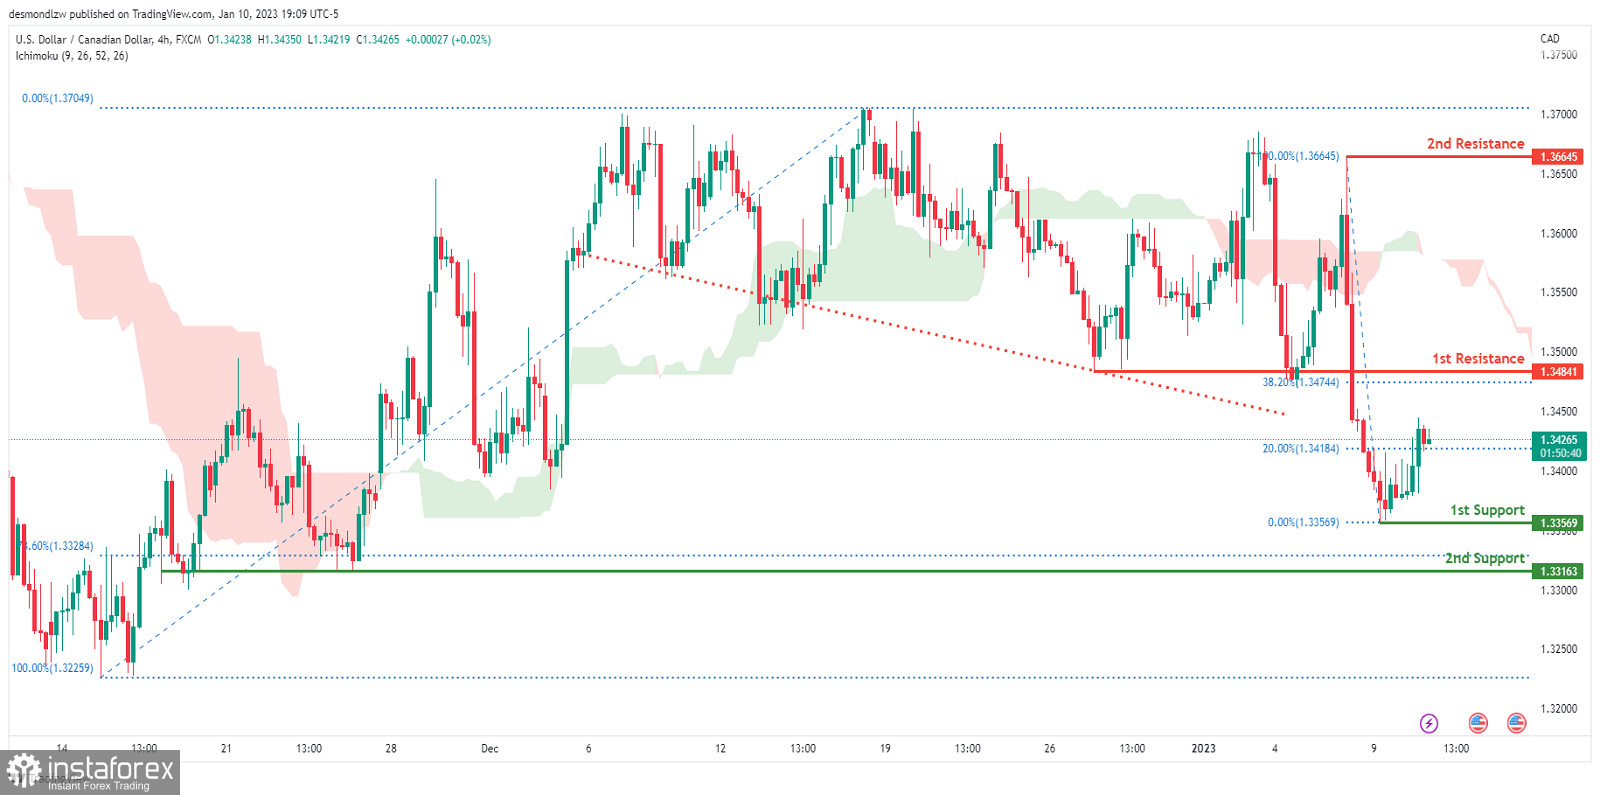
On the H4 chart, the overall bias for USDCAD is bearish. To add confluence to this, the price is below the Ichimoku cloud which indicates a bearish market. To add support to this bias, price has also broken under the descending trendline indicating strong bearish momentum. If this bearish momentum continues, expect the price to possibly head towards the 1st support at 1.33569, where the recent low is. In an alternative scenario, price could head back up to retest the 1st resistance at 1.34841, where the 38.2% Fibonacci line is.
Trading Recommendation
Entry: 1.34841
Reason for Entry:
Retest the 1st resistance line
Take Profit: 1.32259
Reason for Take Profit:2nd support line
Stop Loss: 1.36645
Reason for Stop Loss:
2nd resistance line
You have already liked this post today
*Phân tích thị trường được đăng tải ở đây có nghĩa là để gia tăng nhận thức của bạn, nhưng không đưa ra các chỉ dẫn để thực hiện một giao dịch.

 11.01.2023 12:02 PM