यह भी देखें

 07.04.2026 03:54 AM
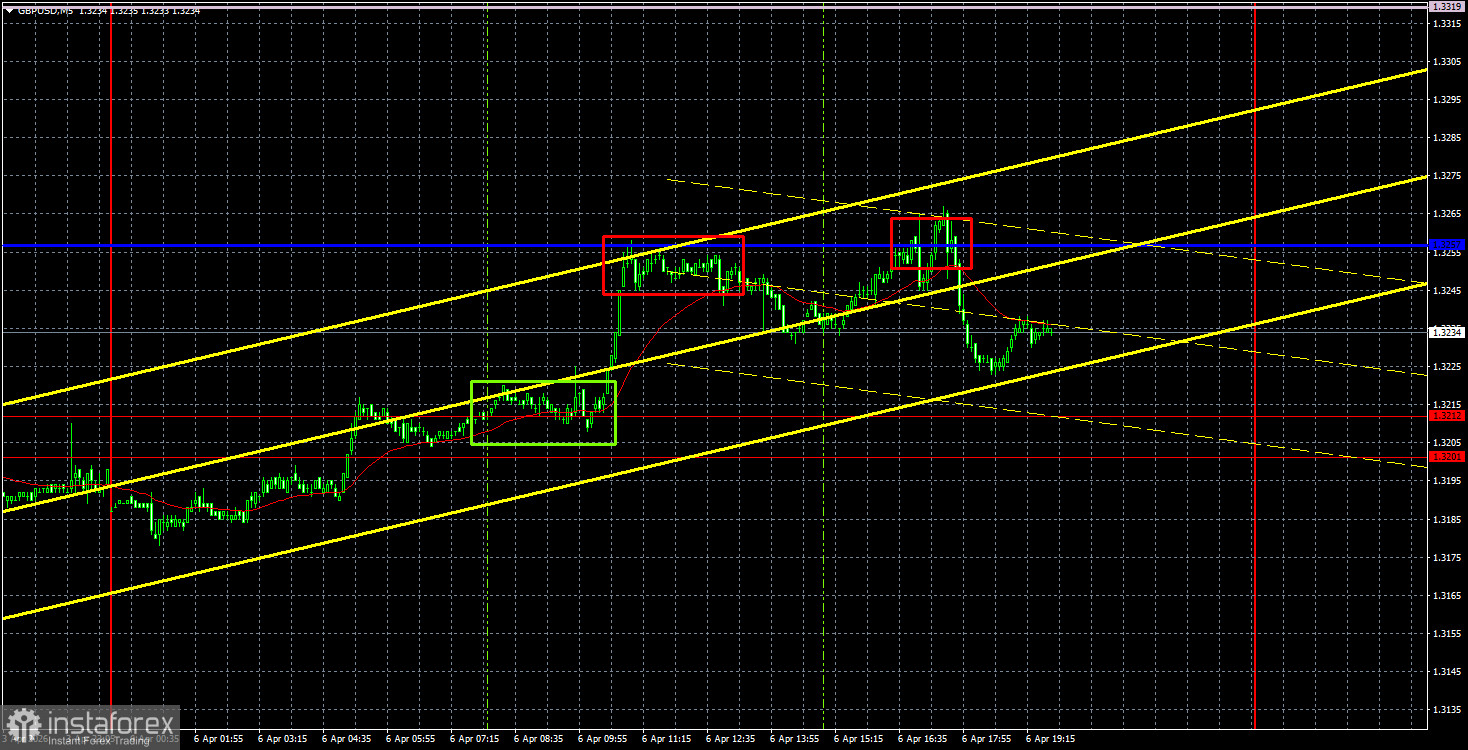
The GBP/USD currency pair showed no interesting movements throughout Monday. There was a slight increase in the first half of the day, followed by a slight decline in the second half. Logically, the rise in the quotes should have continued in the afternoon, as the only ISM Services Index came out worse than expected. However, the macroeconomic background still fails to interest the market, leading to mixed movements at the very bottom.
Overall, the fate of the British pound hangs by a thread. While the euro managed to weather the geopolitical crisis and stabilize, the British pound could slide lower at any time. Today, Donald Trump may order another bombing of Iran, which will inevitably elicit a harsh response from US allies in the Middle Eastern region. If a new escalation occurs, the US dollar may strengthen even further. The dollar finds it much easier to push against the British pound than against the euro.
From a technical standpoint, a downward trend is evident on the hourly timeframe, but any trend right now is risky. The pair's movements are random, depending solely on geopolitical factors. The area between 1.3179 and 1.3187 continues to balance the pair on the edge of a cliff, but new events in the Middle East could provoke another collapse.
On the 5-minute timeframe, three trading signals were formed yesterday. At the beginning of the European trading session, the pair bounced off the area of 1.3201-1.3212 and then quickly rose to the critical line. This was followed by two bounces from the Kijun-sen line, which mirrored each other. Thus, traders could have opened another short position, which could also be closed for a profit by the end of the day.
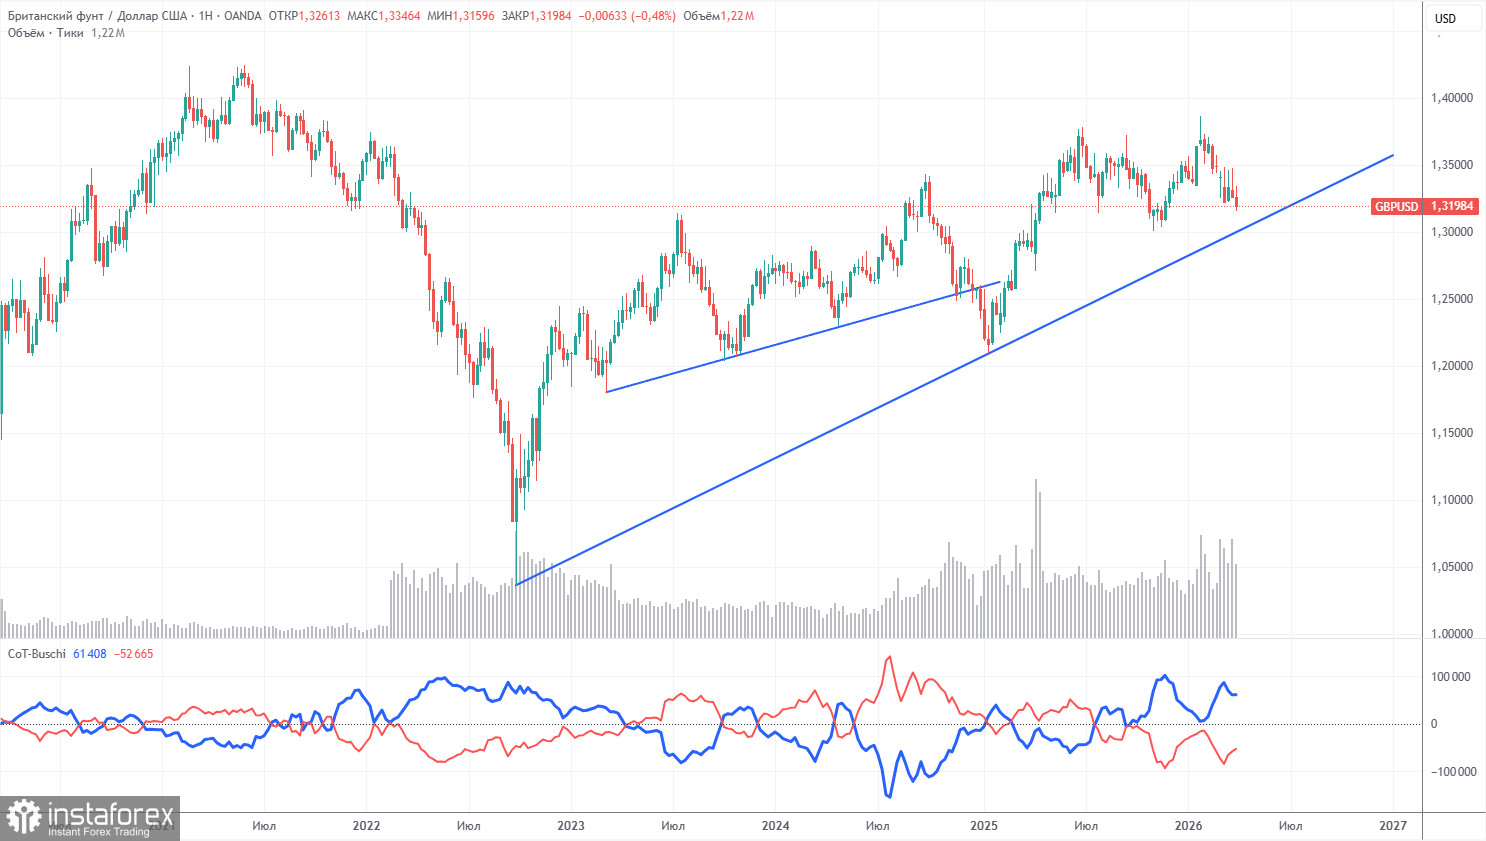
The COT reports for the British pound show that commercial traders' sentiment has been changing steadily in recent years. The red and blue lines representing the net positions of commercial and non-commercial traders frequently cross each other and often hover close to the zero mark. Currently, the lines are moving further apart, with non-commercial traders predominantly holding... short positions. However, given the events in the Middle East, it is not surprising that demand for risk currencies is falling while demand for the dollar is rising.
In the long term, the dollar continues to decline due to Trump's policies, as shown on the weekly timeframe (illustration above). The trade war will continue in one form or another for a long time. However, geopolitical factors currently take precedence, providing strong support for the US currency. According to the latest COT report (dated March 31), the "Non-commercial" group opened 4,800 BUY contracts and closed 900 SELL contracts. As a result, the net position of non-commercial traders increased by 5,700 contracts over the week.
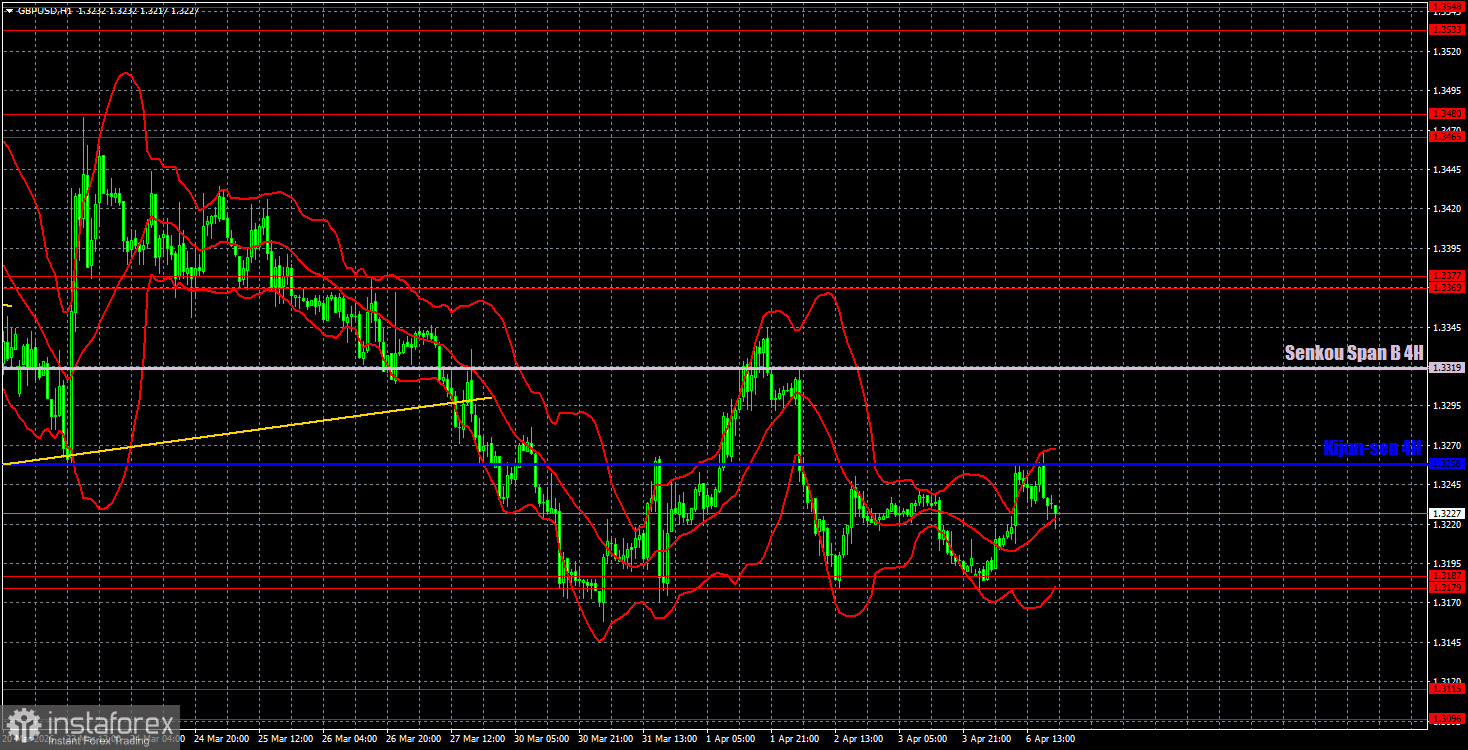
On the hourly timeframe, the GBP/USD pair has shifted to form another downward trend, which could also be canceled soon. The market continues to closely monitor events in the Middle East, which provoke 90% of market movements. Despite the significant decline in the pair in February-March, we still view it as a correction in the long-term (weekly timeframe). The daily timeframe confidently signals the maintenance of an upward trend. Geopolitics continues to dominate the currency market.
On April 7, we highlight the following important levels: 1.3096-1.3115, 1.3179-1.3187, 1.3369-1.3377, 1.3465-1.3480, 1.3533-1.3548, 1.3615, 1.3671-1.3681, 1.3751-1.3763. The Senkou Span B line (1.3319) and Kijun-sen line (1.3258) may also serve as sources of signals. It is recommended to set a Stop Loss at breakeven if the price moves in the correct direction by 20 pips. The lines of the Ichimoku indicator may shift during the day, which should be considered when determining trading signals.
On Tuesday, there are no significant events scheduled in the UK, while in the US, an important report on durable goods orders will be released, which is considered a key indicator. Unfortunately, the market continues to ignore almost all macroeconomic data, and on Tuesday, it will be waiting for a resolution between Iran and the US. Therefore, at any moment, the pair could move sharply in either direction.
Today, traders may consider remaining in short positions targeting 1.3179-1.3187, as the price has bounced off the critical line. Long positions can be reopened with a target at Senkou Span B if the price consolidates above the Kijun-sen line.

