
यह भी देखें


 24.08.2026 10:56 AM
GBP/USD
Analysis:
The direction of the British pound sterling in the major pair has been determined by a downward wave since the beginning of this year. In the short term, the price has predominantly been rising over the past two months, remaining within the correction. The structure of the movement does not appear complete at the time of analysis. The major pair's price is approaching the lower boundary of a strong potential reversal zone on the daily timeframe.
Forecast:
Over the coming week, the upward bias is expected to fully run its course, followed by a change in direction and the beginning of a bearish move. When the direction changes, a sharp increase in volatility and a brief breach of the upper resistance zone cannot be ruled out. The calculated support indicates the lower boundary of the pair's expected weekly range.
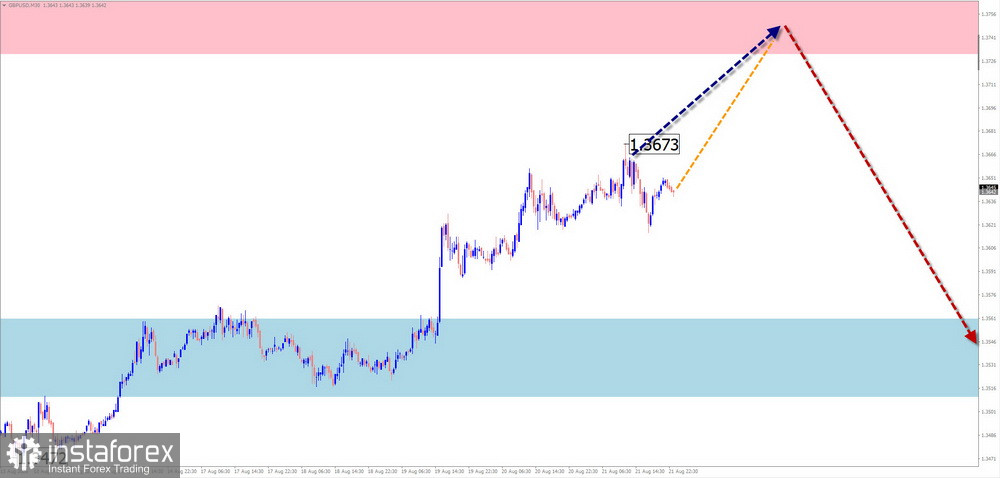
Potential Reversal Zones
Resistance:
Support:
Recommendations:
Purchases: May be made using fractional volumes intraday, no higher than the calculated resistance.
Sales: May generate profit from an intraday decline using reduced lot sizes. Before opening trades, confirmation in the form of reversal signals on your trading systems is required.
AUD/USD
Analysis:
On the chart of the Australian dollar major pair, the downward sideways wave that began at the end of January this year continues to develop. The entire wave has the form of an extended horizontal flat. Its unfinished leg is upward and remains incomplete at present. The potential of the upward leg from June 30 does not exceed the retracement level.
Forecast:
At the beginning of the upcoming week, the upward bias in price movement is expected to continue. A halt is likely within the boundaries of the calculated upper reversal zone. This will be followed by a change in direction and the beginning of a downward move within the established price range. The support zone indicates the most likely lower boundary of the pair's weekly range.
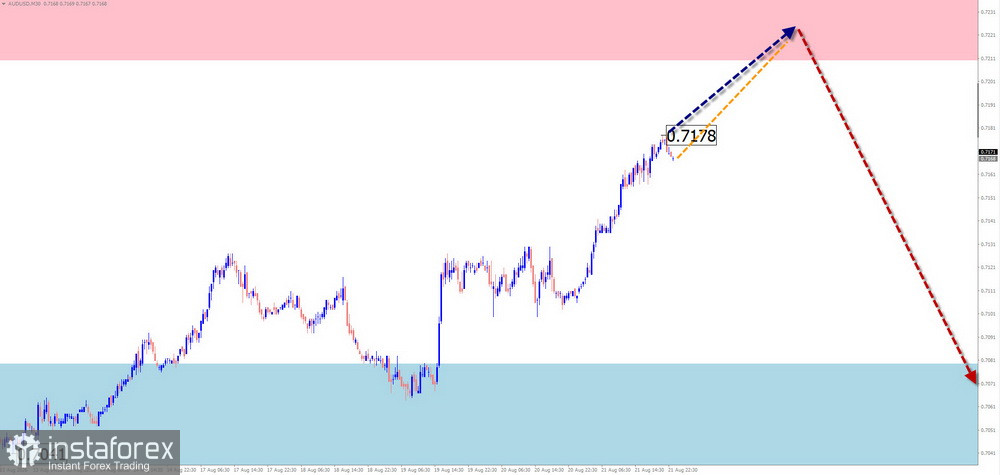
Potential Reversal Zones
Resistance:
Support:
Recommendations:
USD/CHF
Analysis:
On the chart of the Swiss franc major pair, the upward running flat that began in January continues to develop. The price has reached the upper boundary of the potential reversal zone. The wave degree of the counter-trend part that began at the end of June exceeds the retracement level and may qualify as a full correction (B).
Forecast:
At the beginning of the upcoming week, the pair is expected to move predominantly sideways, with a downward bias. Near the support zone, conditions for a reversal may begin to form. A change in direction and a resumption of the upward price movement are likely toward the end of the week.
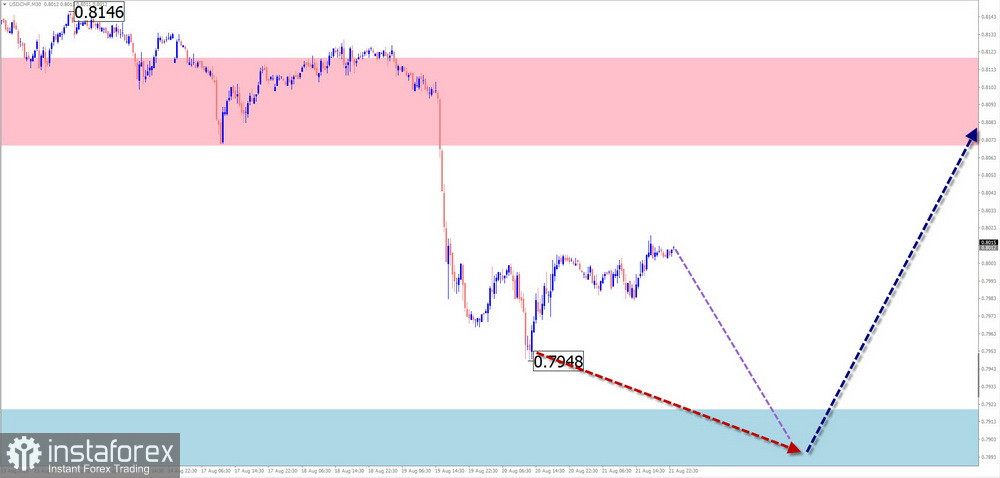
Potential Reversal Zones
Resistance:
Support:
Recommendations:
Purchases: Are premature until confirmed reversal signals appear near support.
Sales: May be made using reduced volume sizes intraday.
EUR/JPY
Analysis:
On the euro/Japanese yen pair chart, the direction of the short-term waves is determined by the algorithm of the pair's global bullish trend. The latest unfinished trend leg began three weeks ago. The structure of the bullish wave does not appear complete at the time of analysis. Within the current wave, a hidden correction has been developing in recent weeks and is close to completion.
Forecast:
At the beginning of the upcoming week, the sideways movement is expected to end. Pressure on the lower boundary of the support zone cannot be ruled out. Most likely, a reversal will occur toward the end of the week, followed by a resumption of active growth in the pair. The resistance zone indicates the upper boundary of the expected weekly range.
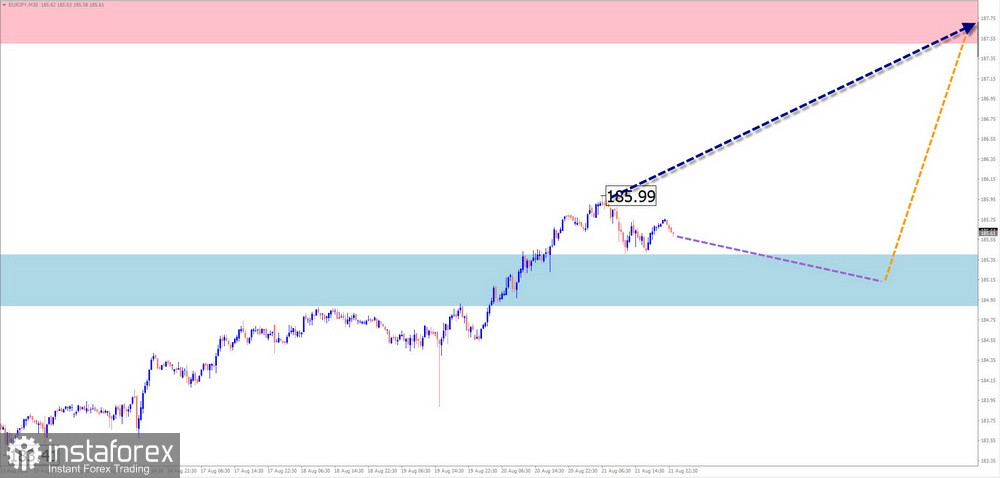
Potential Reversal Zones
Resistance:
Support:
Recommendations:
Sales: Have no potential.
Purchases: Conditions for such trades will not arise until confirmed signals appear near the support zone.
AUD/JPY
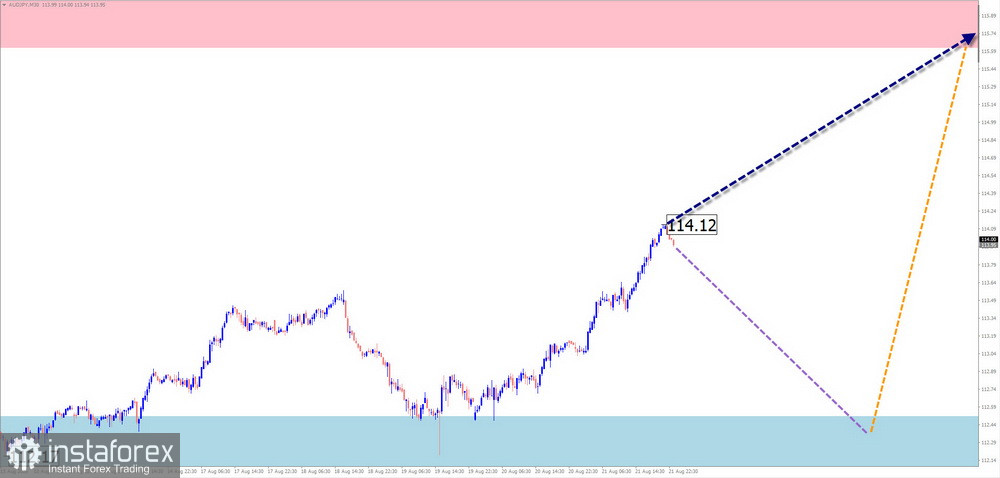
Analysis:
Since April last year, the Australian dollar/Japanese yen pair has been moving predominantly upward on the price chart. The wave that remains unfinished at present is upward in the short term and dates back to August 3. The final part (C) is forming within its structure and is nearing completion. The price is approaching the lower boundary of a strong potential reversal zone on a higher timeframe.
Forecast:
At the beginning of the upcoming week, sideways price movement is expected. A downward bias is more likely. In the second half of the week, a resumption of price growth may be expected, with the price rising as far as the resistance zone.
Potential Reversal Zones
Resistance:
Support:
Recommendations:
EUR/GBP
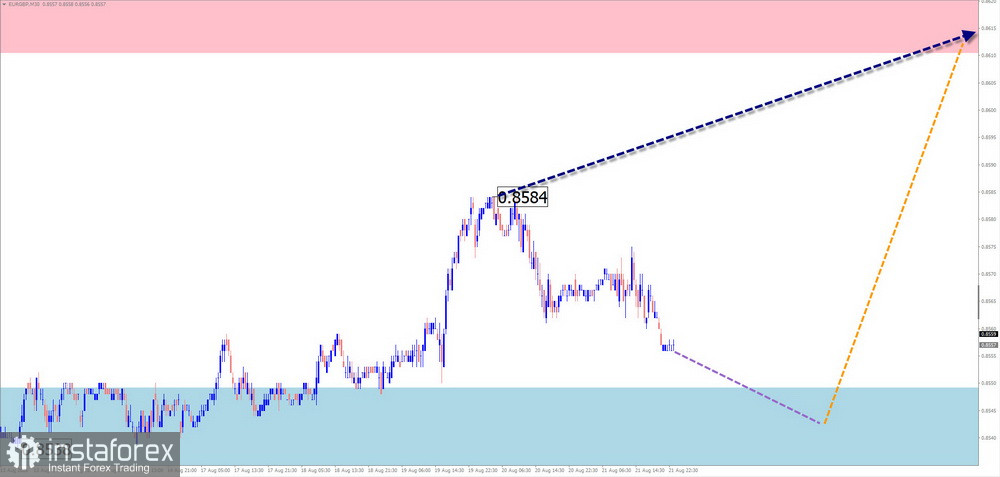
Analysis:
Judging by the combination of several factors, the downward trend that has determined the main direction of the euro/pound pair since last year appears to have come to an end. The price is within the boundaries of a strong resistance zone. The counter-trend movement dates back to mid-July and has the form of a running flat. Its high wave potential suggests that it is at least developing into a full correction.
Forecast:
During the upcoming week, overall sideways movement in the cross is expected to continue. A brief decline is possible during the first few days, and pressure on the lower boundary of the support zone cannot be ruled out. The highest level of activity, a reversal, and the beginning of an upward move may occur toward the end of the current week or next week.
Potential Reversal Zones
Resistance:
Support:
Recommendations:
Ethereum
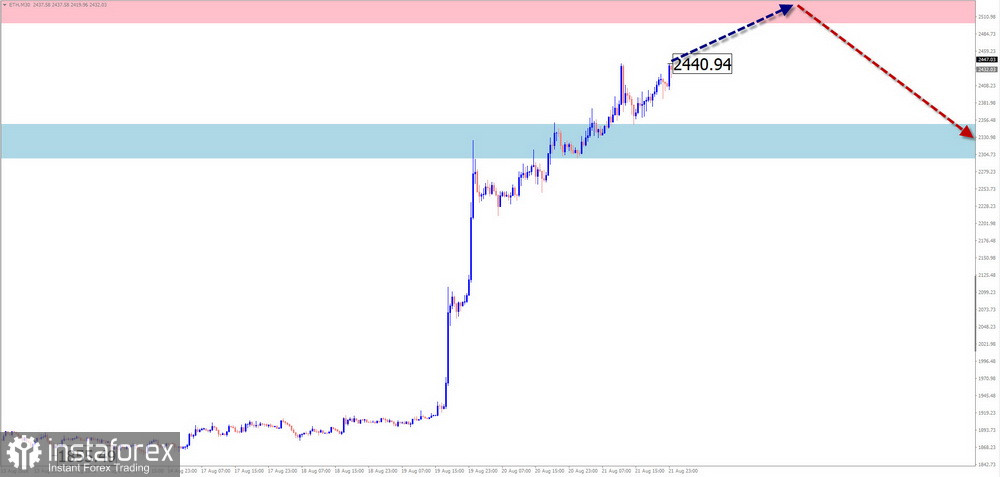
Analysis:
The upward wave in Ethereum that began in February this year has entered its final phase. Within its structure, the final leg, taking the form of an extended flat, is nearing completion. Several potential reversal zones of different wave degrees are located near the calculated resistance.
Forecast:
Over the upcoming week, Ethereum's price is expected to gradually move toward the resistance boundaries. During the first few days, sideways movement is highly likely. Near resistance, the price is then expected to halt and conditions for a reversal to form. When the direction changes, a sharp increase in volatility and a breach of the upper resistance boundary cannot be ruled out.
Potential Reversal Zones
Resistance:
Support:
Recommendations:
Purchases: Permitted during individual trading sessions using fractional volumes.
Sales: Are not appropriate until confirmed reversal signals appear near support.
Notes: In simplified wave analysis (SWA), all waves consist of three parts (A-B-C). On each timeframe, only the latest unfinished wave is analyzed. A solid background behind the arrows indicates the formed structure, while a dashed background indicates the expected movements.
Attention: The wave algorithm does not take into account the duration of an instrument's movements over time!

