Vea también

 25.03.2026 08:02 AM
Bitcoin continues a sort of upward move that is merely a correction and has lasted about a month and a half. On the daily timeframe, it's clear the current rise is a weak retracement, and there is a liquidity pool below that price is likely to revisit with roughly 90% probability. On the 4-hour timeframe, you can see how slowly Bitcoin is rising, if it is rising at all. Fast, sharp drops combined with slow, soft gains are classic signs of a downtrend. Our view, therefore, remains unchanged — the downtrend is not over; the market is in a pause.
Meanwhile, CryptoQuant reports that trading volumes in altcoins on centralized exchanges have fallen to year-low levels. In October last year, when the crypto market crash "wiped out" many traders, altcoins largely lost traders' interest. Many altcoins fell almost to zero back then, which reminded market participants how fragile and speculative many of these tokens are. While majors like Bitcoin, Ethereum and Solana lost 10–30%, some altcoins lost up to 100%. What sense is there in investing in such cryptos if their value can collapse to zero at any moment?
There was much talk last year about the start of an altcoin season, but it never materialised. Currently on Binance, total altcoin trading volumes are about $8 billion. Last year, that figure regularly hit $40–50 billion. If altcoins didn't get a kick last year, what are the odds that they will rally now, while Bitcoin has been in a downtrend for half a year?
Right now, the market is not even generous to Bitcoin — it prefers to protect capital in safe assets. So altcoins are unlikely to attract much attention. Bitcoin remains afloat thanks to its status, but many experts forecast further declines.
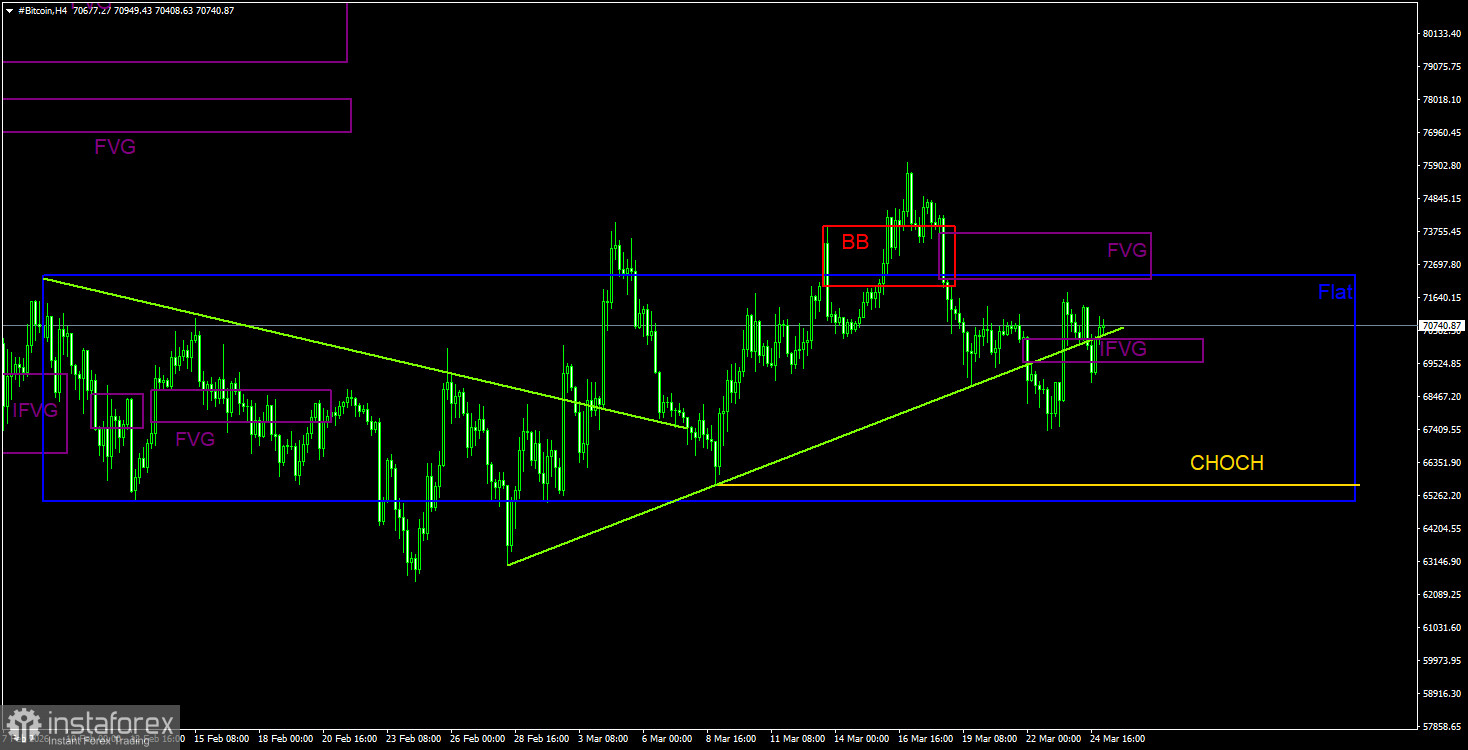
Bitcoin continues to form a full?fledged downtrend. We still expect a decline toward $57,500 (the 61.8% Fibonacci retracement of the three?year uptrend), and there are no signs of a trend reversal at this time. Even $57,500 no longer looks like the final stop. From POI areas, note only the nearest bearish FVG on the daily timeframe, which sits quite far from the price. On the 4?hour TF, the character of Bitcoin's movement shows all the hallmarks of a range. Down below, an obvious target remains — the liquidity pool beneath the daily TF trendline.
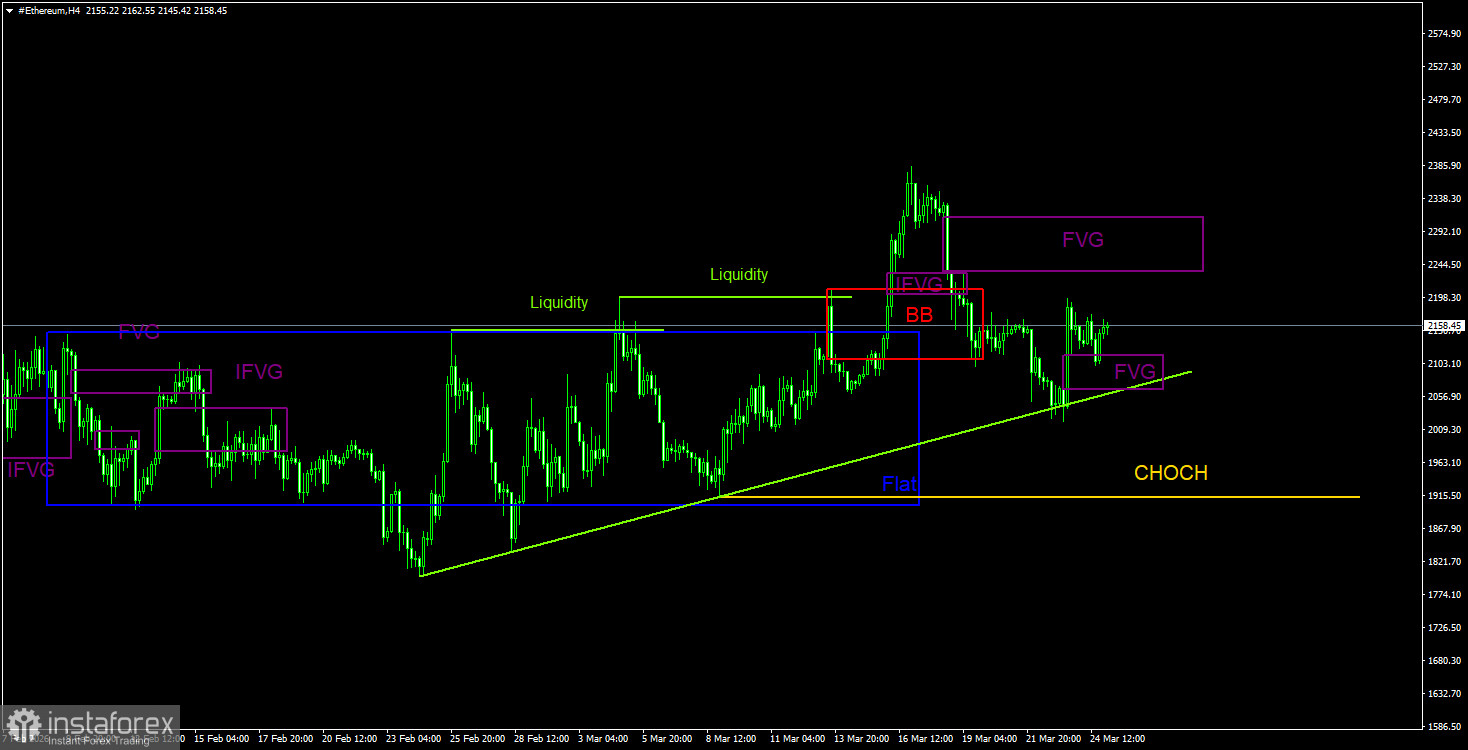
A downtrend continues to form on the daily TF. The key sell pattern has been and remains the bearish order block on the weekly TF. As we warned, the move triggered by that signal can be strong and prolonged. Since its formation, Ethereum has already lost about 55% (roughly $2,500). In the near term, an upside correction remains possible; the 4?hour order block has been invalidated, and the coin has left the sideways channel. On Monday, a bullish FVG formed on the 4?hour TF, and the price reacted to it, so the rally may continue toward a bearish FVG, from which a new leg of decline could begin. Buying on a downtrend should be cautious and short?lived.
CHOCH — change of character / break of the trend structure. Liquidity — liquidity, traders' Stop?Losses that market?makers use to build their positions. FVG — Fair Value Gap (area of price inefficiency). The price often moves quickly through such areas, indicating the absence of one side in the market. Later, the price tends to return and react to these zones. IFVG — Inverted Fair Value Gap. After a return to such a zone, the price does not react but impulsively breaks through and then tests it from the other side.
OB — Order Block. A candle on which a market-maker opened a position in order to harvest liquidity and then form their own position in the opposite direction.


