Vea también

 15.06.2026 05:15 AM
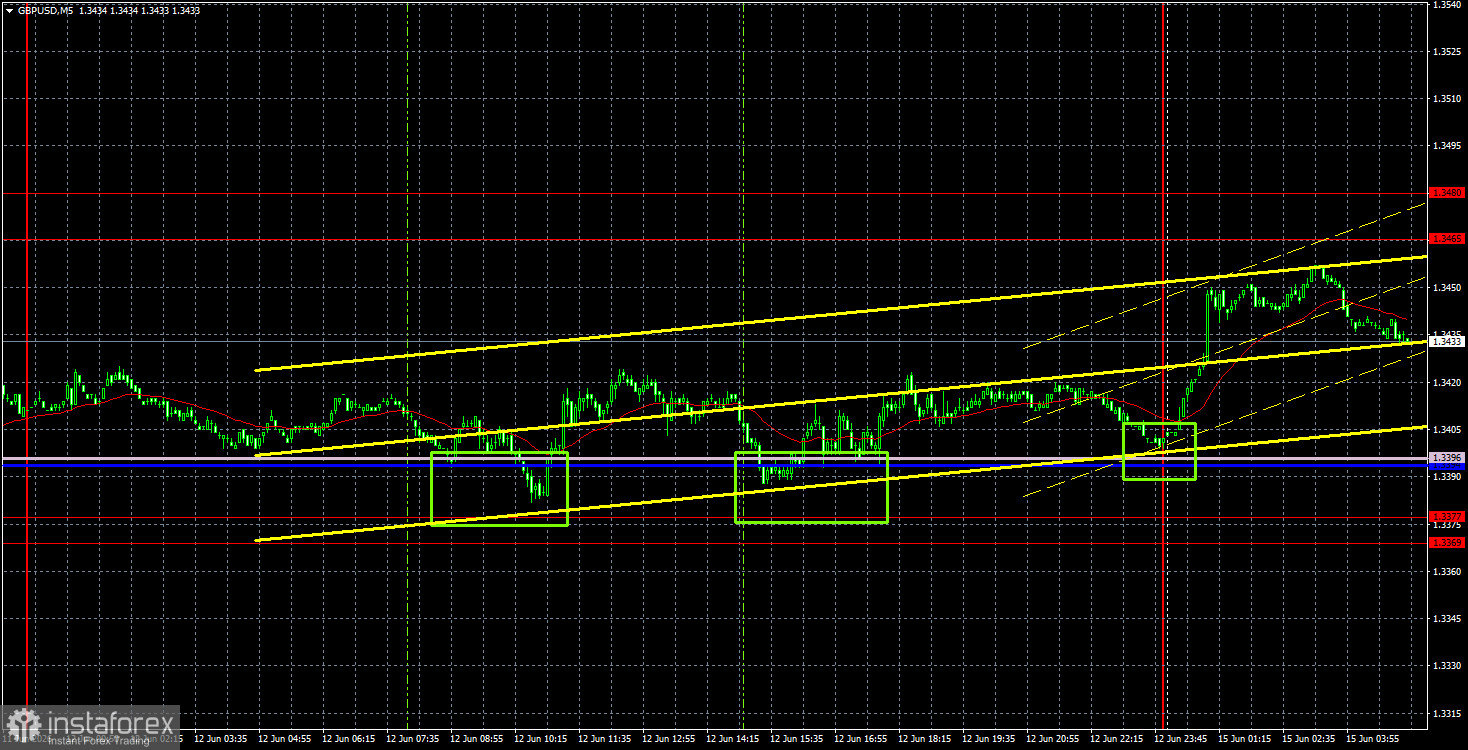
The GBP/USD currency pair showed no notable movement on Friday, and volatility was low. Predictably, macroeconomic reports from the UK did not attract traders' interest, and there were no geopolitical events. The most interesting things (as has often been the case in recent weeks) happened over the weekend. While the deal between Iran and the US was not signed, Donald Trump announced on Monday night that an agreement had been reached with Iran and that the Strait of Hormuz was open. As of now, it is unknown whether Tehran has indeed opened the Strait of Hormuz, but it is certain that the deal has not yet been signed. No confirmations have been received from Iran. Thus, we saw an upward movement in the pair overnight, explained by dollar sell-offs, but we want to note that the nature of those sell-offs was not massive. The market reacted to Trump's statements, but there is still doubt that everything will go as the American president said.
From a technical standpoint, the downward trend is canceled as the price has crossed the Ichimoku indicator lines. However, whether the upward movement will continue is still a big question. This will depend on geopolitics. If it turns out today that Trump made false statements again, the dollar will rise, and the British pound will fall. If Trump's words are confirmed during the week, demand for the US currency will continue to decrease.
In the 5-minute timeframe, two buy signals were generated on Friday, in the form of rebounds from the 1.3369-1.3396 area. However, throughout the day, there was sideways movement, so no profit or loss was achieved from this trade. A third similar buy signal was formed overnight, after which the pair moved up by about 40 pips.
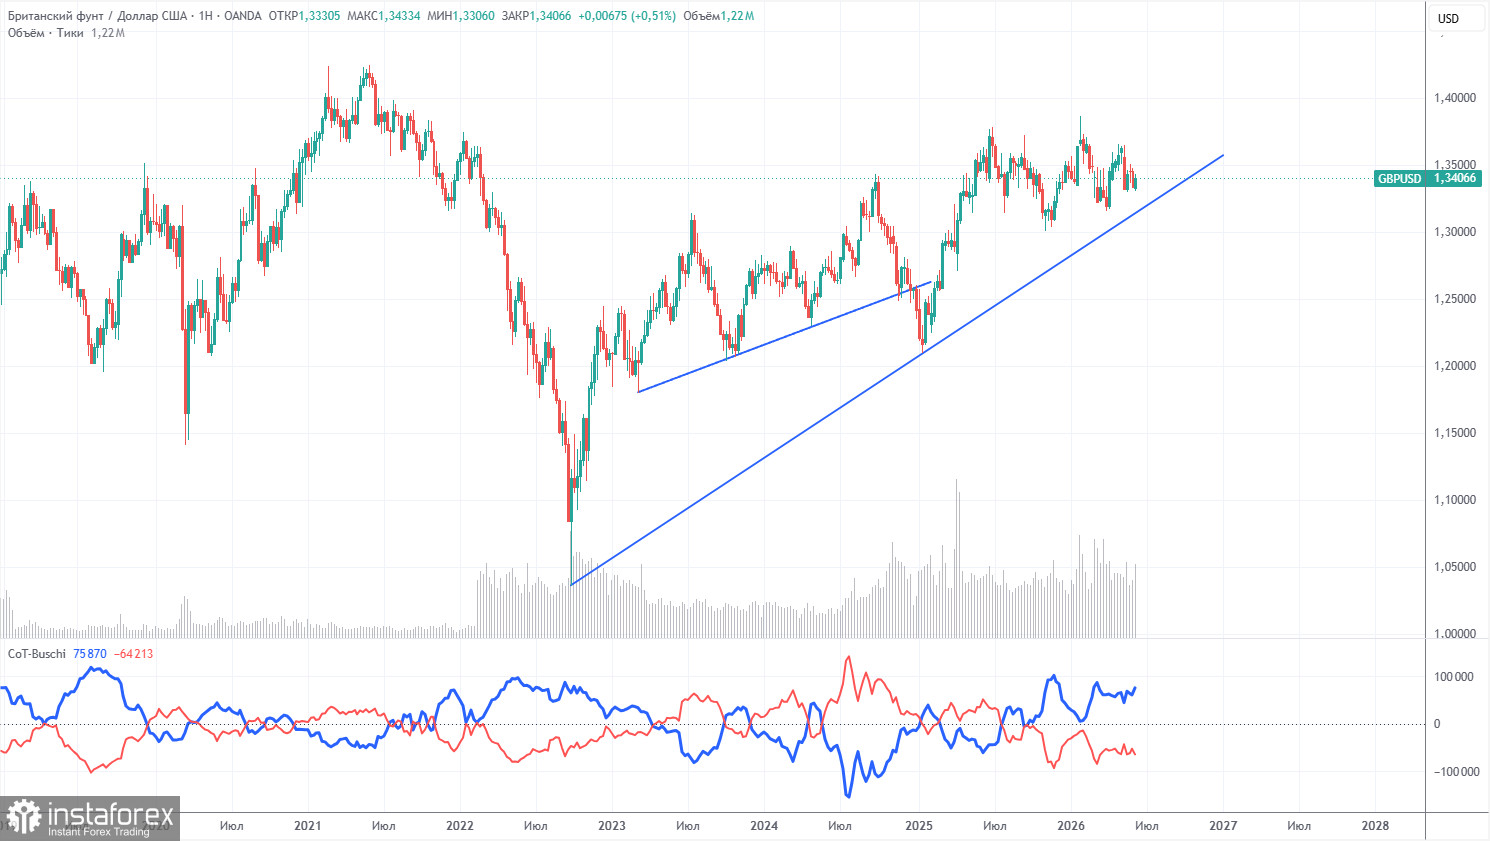
COT reports on the British pound show that commercial traders' sentiment has been constantly changing in recent years. The red and blue lines, which represent the net positions of commercial and non-commercial traders, frequently cross each other and are mostly close to the zero mark. Currently, the lines are distancing from each other, and non-commercial traders still dominate with... shorts. Given the events in the Middle East, it is not surprising that demand for risk currencies is low.
In the long term, the dollar continues to weaken due to Trump's policies, which is evident on the weekly timeframe (illustration above). The trade war will continue in one form or another for a long time, and Trump's policies are aimed directly and indirectly at weakening the US currency. However, geopolitical factors are currently at the forefront, providing strong support for the dollar lately. Since the conflict in the Middle East is not yet resolved, the US dollar may still show growth potential. According to the latest COT report (as of June 9), the "Non-commercial" group closed 7,900 Buy contracts and opened 4,000 Sell contracts. Thus, the net position of non-commercial traders decreased by 11,900 contracts over the week.
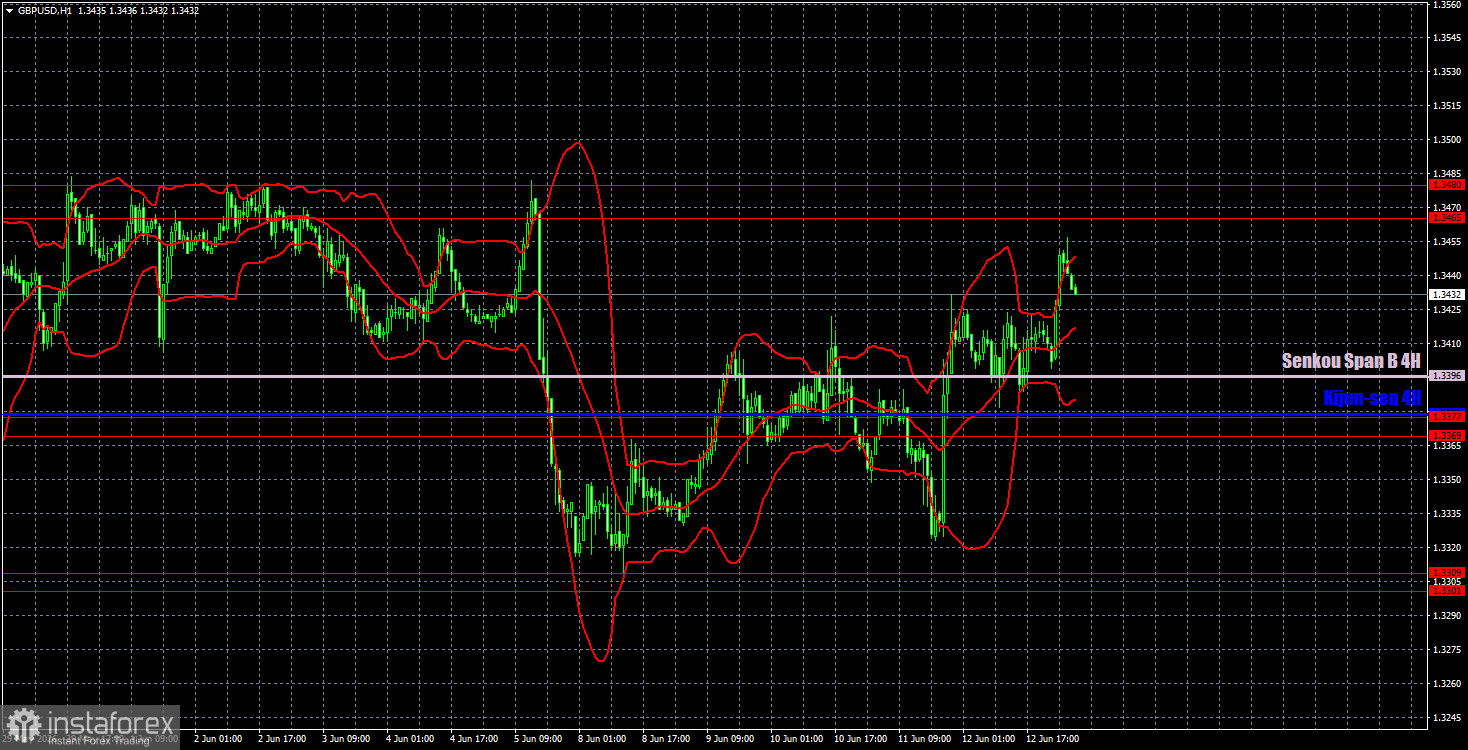
On the hourly timeframe, the GBP/USD pair has begun to form a new upward trend amid warming relations between Iran and the US. The macroeconomic and fundamental background still does not have a significant impact on the pair's movements (with rare exceptions). We do not believe that without a real escalation of the conflict in the Middle East, the dollar will be able to show a strong trend, and de-escalation of the conflict and a peace deal will support further growth of the pair.
For June 15, we highlight the following important levels: 1.3096-1.3115, 1.3179-1.3187, 1.3301-1.3309, 1.3369-1.3377, 1.3465-1.3480, 1.3588, 1.3671-1.3681, and 1.3751-1.3763. The Senkou Span B line (1.3396) and the Kijun-sen line (1.3378) may also serve as signal sources. It is recommended to set the Stop Loss level to break even if the price moves in the right direction by 20 pips. The Ichimoku indicator lines may shift throughout the day, which should be considered when determining trading signals.
On Monday, there are no important events or reports scheduled in the United Kingdom, while in the United States, a report on industrial production will be released, which is unlikely to provoke a market reaction. Today, traders will be awaiting actual confirmation of Trump's words regarding the opening of the Strait of Hormuz.
Today, traders may consider short positions targeting the 1.3396-1.3377 area if the price rebounds from the 1.3465-1.3480 area. Long positions may become relevant if the price consolidates above the 1.3465-1.3480 area, with a target of 1.3588.
Support and resistance price levels – thick red lines, around which the movement may end. They are not sources of trading signals.
Kijun-sen and Senkou Span B lines – Ichimoku indicator lines, transferred to the hourly timeframe from the 4-hour timeframe. They are strong lines.
Extreme levels – thin red lines from which the price previously rebounded. They are sources of trading signals.
Yellow lines – trend lines, trend channels, and other technical patterns.
Indicator 1 on COT charts – the size of the net position of each category of traders.


