Vea también

 18.06.2026 06:00 AM
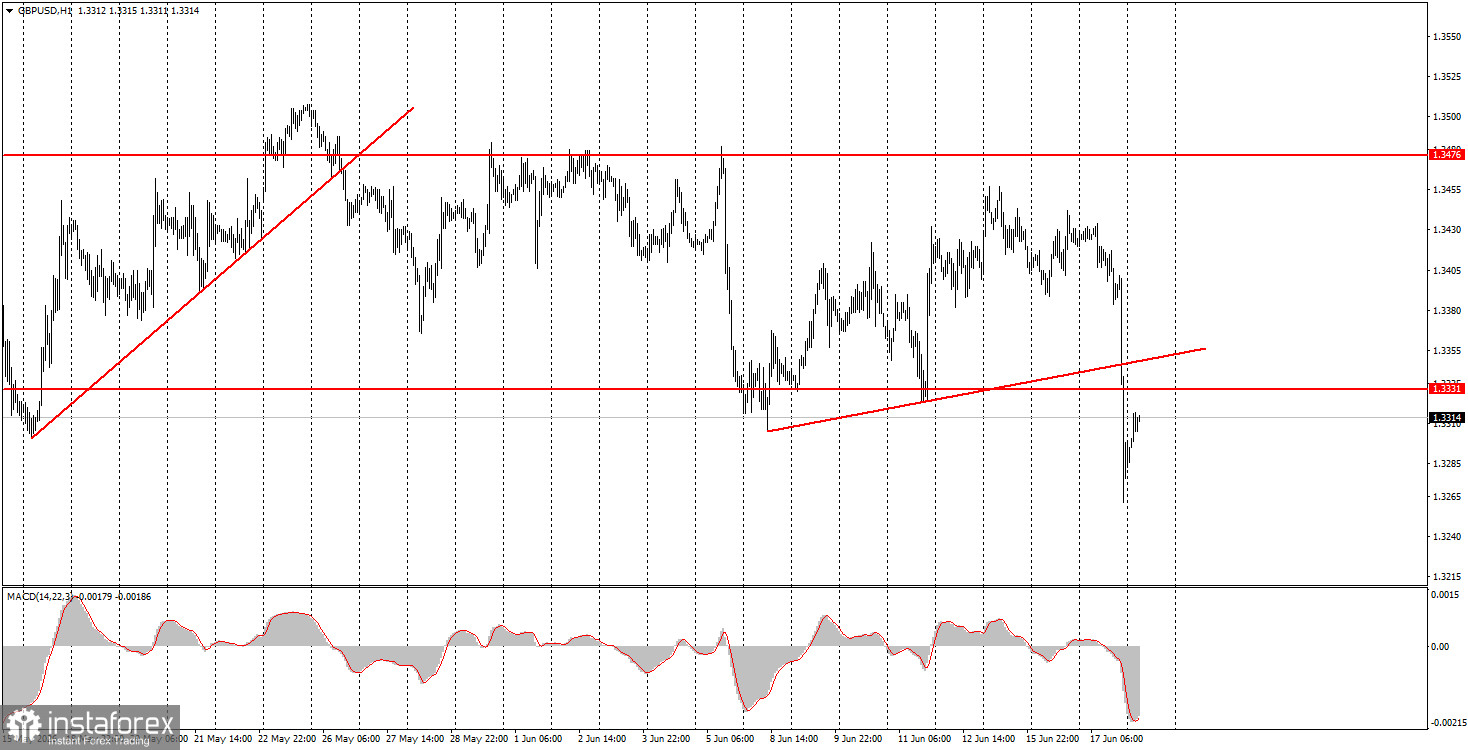
The GBP/USD pair traded lower throughout Wednesday. The British pound had been trading within a sideways channel of 1.3331-1.3476 for over a month, but yesterday it declined sharply, triggered by the Federal Reserve. As we mentioned, we do not believe that the results of Kevin Warsh's first meeting were entirely unexpected. With inflation accelerating to 4.2% over three months, a tightening sentiment from the central bank was to be expected. We still consider that the market reacted too vigorously; traders had been anticipating precisely the scenario proclaimed by the Fed—one rate hike by the end of the year. Therefore, we do not believe that the U.S. dollar will continue to rise. Of course, if the deal between Iran and the U.S. collapses again or if a ceasefire is violated once more, the market may turn to the "safe haven" of the dollar again. However, there is little reason to expect a deal to fail that has not even been signed yet. Nevertheless, Donald Trump is already showing a somewhat aggressive stance.
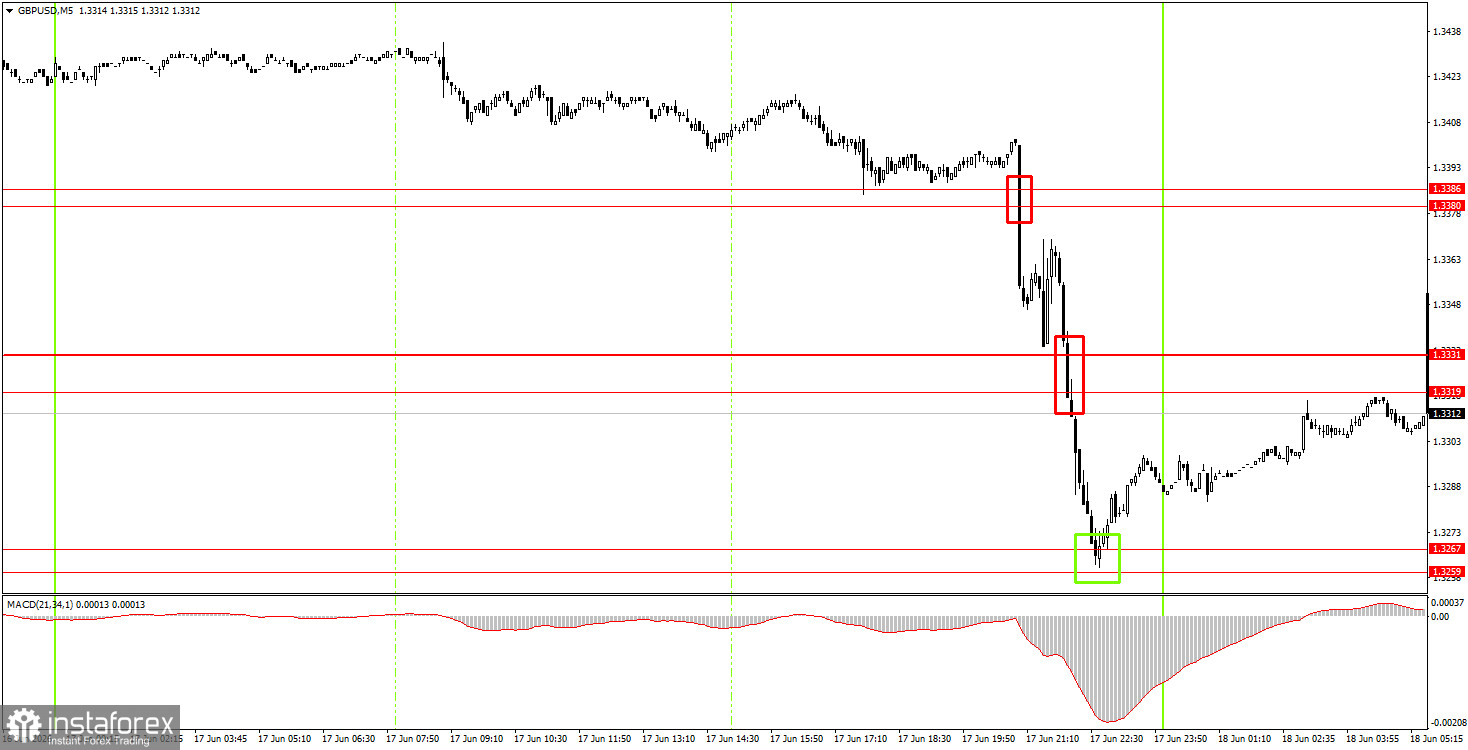
On the 5-minute timeframe, three trading signals were generated on Wednesday. Immediately after the FOMC meeting, the pair settled below the 1.3380-1.3386 area, and shortly after, below the 1.3319-1.3331 area. Thus, novice traders had an opportunity to open one short position, and the price ultimately worked its way to the target area of 1.3259-1.3267. A bounce from this area enabled the opening of long positions, which yielded a profit of about 40 pips by Thursday morning.
On the hourly timeframe, the GBP/USD pair has left the sideways channel, but we doubt that the decline will continue. Of course, if serious reasons arise for the dollar to strengthen further, this possibility exists. However, there are currently no such reasons. The conflict in the Middle East is nearing resolution, and the Fed has only signaled a possible rate hike by year-end. This factor has already been priced into the market.
On Thursday, novice traders can open short positions targeting 1.3259-1.3267 if the price bounces from the 1.3319-1.3331 area. A price consolidation above the 1.3319-1.3331 area will allow for long positions to be opened with targets of 1.3380-1.3386.
On the 5-minute timeframe, trading can currently focus on levels 1.3175-1.3180, 1.3259-1.3267, 1.3319-1.3331, 1.3380-1.3386, 1.3456-1.3476, 1.3587-1.3598, 1.3631-1.3641, 1.3695, and 1.3741-1.3751. On Thursday, the Bank of England will announce its meeting results in the UK. The key rate is expected to remain unchanged, but predicting the outcome of the Monetary Policy Committee's vote on the rate in advance is impossible. A situation similar to yesterday's FOMC meeting could arise, in which the number of "hawks" might be greater or fewer than the market expects, triggering movement.
Price levels (areas) of support and resistance are targets when opening long or short positions or sources of signals.
Red lines indicate channels or trend lines that display the current trend and indicate the preferred direction for trading.
The MACD indicator (14,22,3) – histogram and signal line – is a supplementary indicator that can also be used as a source of signals.
Important speeches and reports (contained in the news calendar) can significantly impact the movement of the currency pair. Therefore, during their release, trading should be conducted with maximum caution, or one should exit the market to avoid sharp reversals against preceding movements.
Beginners trading in the forex market should remember that not every trade can be profitable. Developing a clear strategy and practicing money management are key to long-term success in trading.


