Vea también

 26.06.2026 04:21 AM
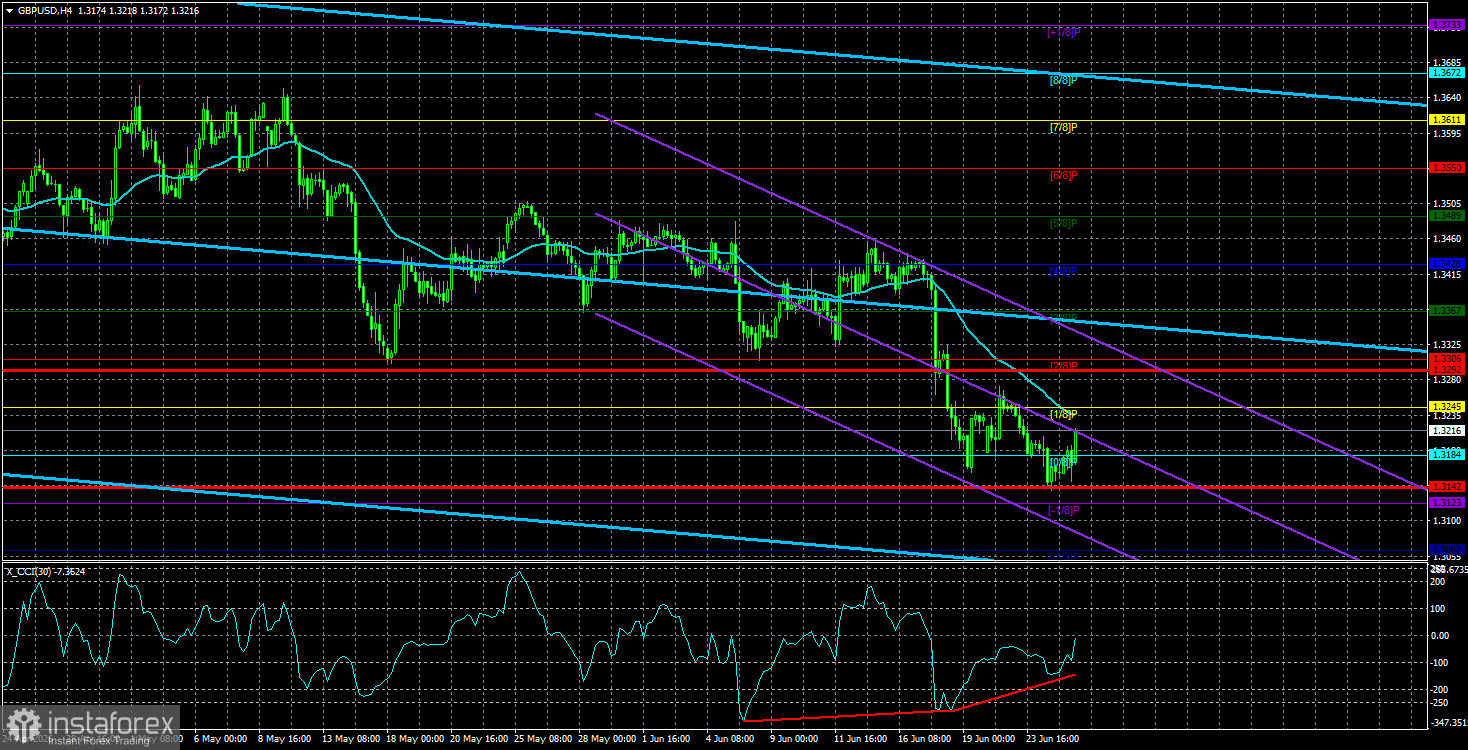
The GBP/USD currency pair also attempted to resume its downward movement on Thursday, but this time it did not go well. Once again, we draw traders' attention to the fact that on Thursday, the U.S. dollar had solid reasons to show growth. The third estimate of U.S. GDP in the first quarter was higher than the previous two estimates, the previous quarter, and expert forecasts of 2.1%. This means the market had every reason to buy the U.S. currency on Thursday, but it did not take advantage of this opportunity, despite having bought dollars for over a week without always having a clear reason.
The CCI indicator entered the oversold area twice and also formed two bullish divergences. Of course, indicators do not control market behavior; they merely signal certain patterns and trends. However, the CCI indicator does not enter extreme areas very often. Therefore, this is a technical signal warning that the downward trend should have ended long ago.
What do we have in the end? There were no compelling reasons for the GBP/USD pair to fall by 250 pips in one week. Let us remind you that the only day during this period when the pound showed growth was Monday, the day of Keir Starmer's resignation as Prime Minister of the UK. In other words, the market actually rejoiced at Starmer's departure, regardless of what anyone says about the political crisis in the UK. Political reshuffles in Great Britain have long been a familiar, even mundane, phenomenon that the market perceives with hopes of improvement. Thus, the political crisis is not a reason for the decline of the British pound.
Further analysis indicates that the Federal Reserve has indicated that the key rate may be raised 1-2 times by the end of the year; however, tightening will not begin until September at the earliest. Given the conclusion of the conflict in the Middle East, the opening of the Strait of Hormuz, and the fall in oil prices, it is uncertain whether tightening is needed at all. Most likely, the Fed will raise rates one or two times to bring inflation back to around 2%. However, these measures will be temporary, not long-term.
The most important point is that the conflict in the Middle East is over, so demand for the safe dollar should have decreased, not increased. It turns out the factors that could have supported the dollar did not. Meanwhile, all other factors unrelated to the rise of the American currency ultimately triggered its increase. A paradox or, to be more precise, illogic.
We believe that such movements defy logic and analysis and may well be manipulation by market makers. Let us remind you that since the beginning of the year, all leading global analysts, banks, and companies have predicted a fall of the U.S. dollar. All experts noted that the U.S. currency could only enjoy market support in conditions of geopolitical tension, acting as a "safe haven." Thus, not only do we see the current illogicality of what is happening, but we also believe that this movement has no foundation or basis. How much longer will any rise of the dollar be explained by the tightening views on the Fed's monetary policy?
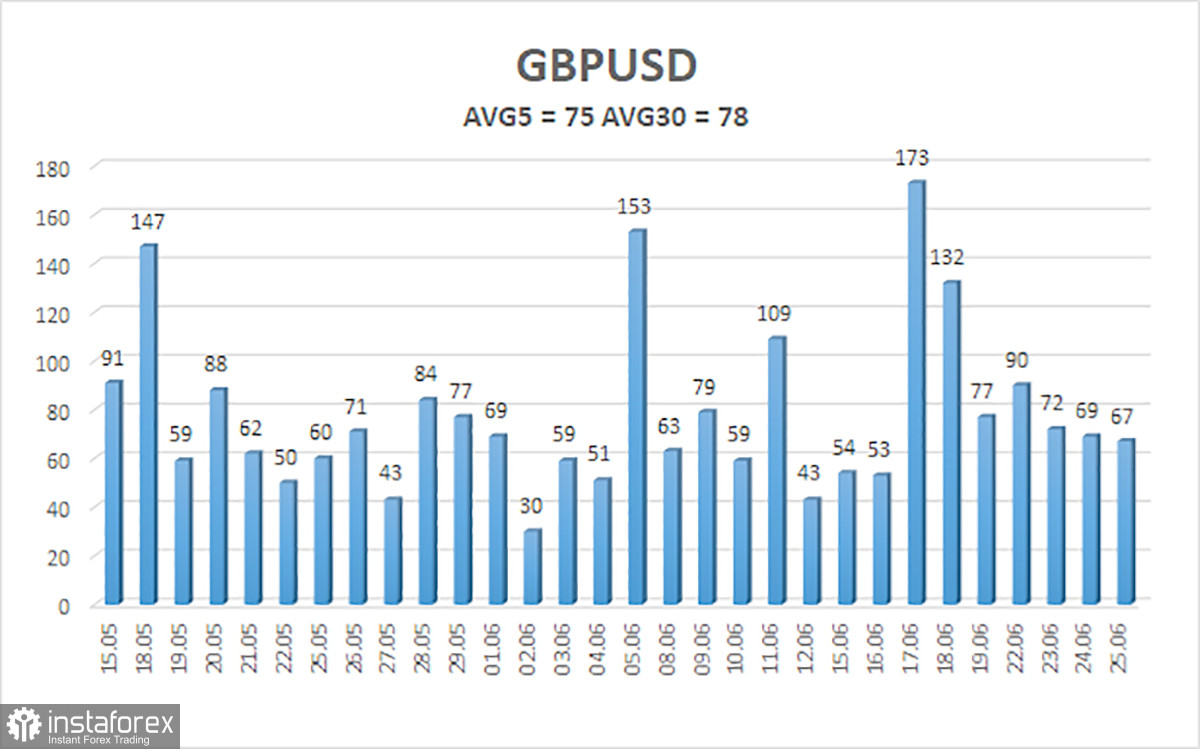
The average volatility of the GBP/USD pair over the last 5 trading days is 75 pips. For the pound/dollar pair, this value is "average." On Friday, June 26, we thus expect movements within the range limited by the levels of 1.3142 and 1.3292. The upper channel of the linear regression is directed sideways, indicating uncertainty in the trend. The CCI indicator has entered the oversold area for the second time and has formed two bullish divergences, suggesting a possible end to the downward trend, but the market is currently ignoring all factors.
S1 – 1.3184
S2 – 1.3123
S3 – 1.3062
R1 – 1.3245
R2 – 1.3306
R3 – 1.3367
The GBP/USD currency pair maintains its downward trend. Trump's policies will continue to put pressure on the U.S. economy, so we do not expect long-term growth in the U.S. dollar. The year 2026 appears to be super positive for the dollar due to geopolitical factors and, more recently, the Fed's readiness to raise the key rate. Long positions with targets at 1.3306 and 1.3367 can be considered when the price is above the moving average, but they are not currently a priority. The price below the moving average line allows for continued bearish trading, with targets at 1.3142 and 1.3123.
Linear regression channels help identify the current trend. If both are directed in the same way, the trend is currently strong;
The moving average line (settings 20.0, smoothed) determines the short-term trend and the direction in which trading should be conducted;
Murray levels are target levels for movements and corrections;
Volatility levels (red lines) indicate the likely price channel within which the pair will stay in the coming day, based on current volatility metrics;
The CCI indicator – its entry into the oversold area (below -250) or the overbought area (above +250) indicates that a trend reversal is approaching in the opposite direction.


