আরও দেখুন

 01.04.2026 11:03 AM
Bitcoin has been in a kind of upward move for about a month and a half, which in practice is a correction. This is clearly visible on the daily timeframe. The liquidity pool below remains untouched, and the price is 90% likely to move toward it. On the 4-hour timeframe, it's clear that the price has returned to a sideways channel. Thus, our view remains unchanged — the downtrend is not over, the market is on pause.
Meanwhile, analysts have drawn a predictable conclusion about the real value of Michael Saylor's Bitcoin assets. MicroStrategy currently holds roughly 762,000 coins of "digital gold," which at current prices are valued at $51.5 billion. Here's the interesting part. If the company, for some reason, tried to sell even half of its coins, it wouldn't be able to do so because of insufficient liquidity. Imagine about 370,000 bitcoins hitting exchanges in a short period — the price would immediately crash like a stone because supply could not be absorbed by demand. Experts estimate that if all the coins were sold, the company could raise at most $20 billion.
Therefore, MicroStrategy becomes a hostage to its own "buy Bitcoin with all the money" strategy. Now, it has no choice but to keep buying or at least not sell. Of course, it can liquidate some of its holdings without a major loss, but at the moment, all of Saylor's Bitcoin investments are underwater. The average purchase price for the 762,000 coins is higher than the current price. Incidentally, MicroStrategy is currently valued at $57 billion. In other words, the company is essentially worth what its bitcoins are worth. The company's market capitalization is estimated at about $40 billion, and the mNAV metric has already fallen to 0.79.
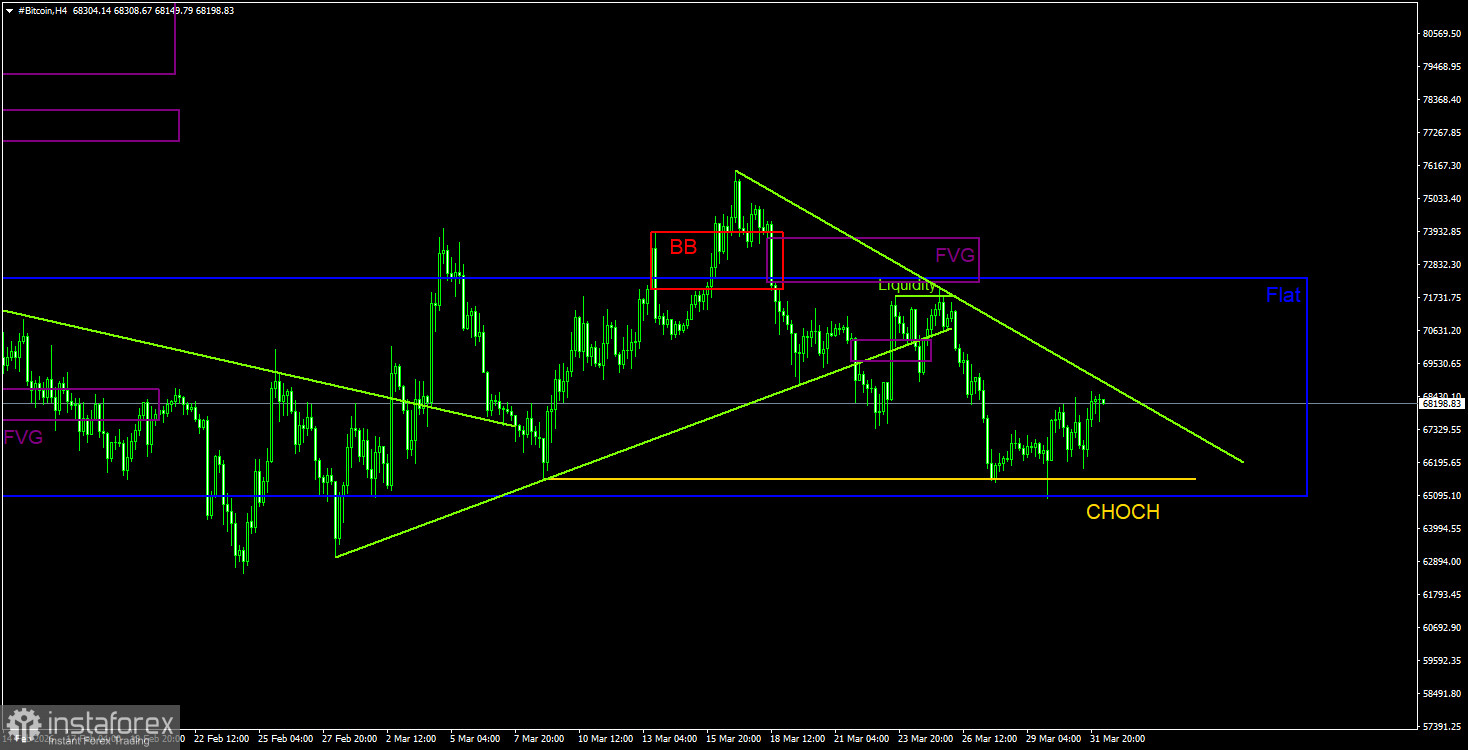
Bitcoin is still following a full-fledged downtrend. We still expect a decline toward $57,500 (the 61.8% Fibonacci level of the three-year uptrend), and there are currently no signs of a trend reversal. Even $57,500 no longer looks like the final stop. From the POI areas, only the nearest bearish FVG on the daily timeframe stands out. On the 4-hour timeframe, Bitcoin's movement again shows all the signs of a flat/range market, so now it makes sense to track only deviations of the sideways channel borders.
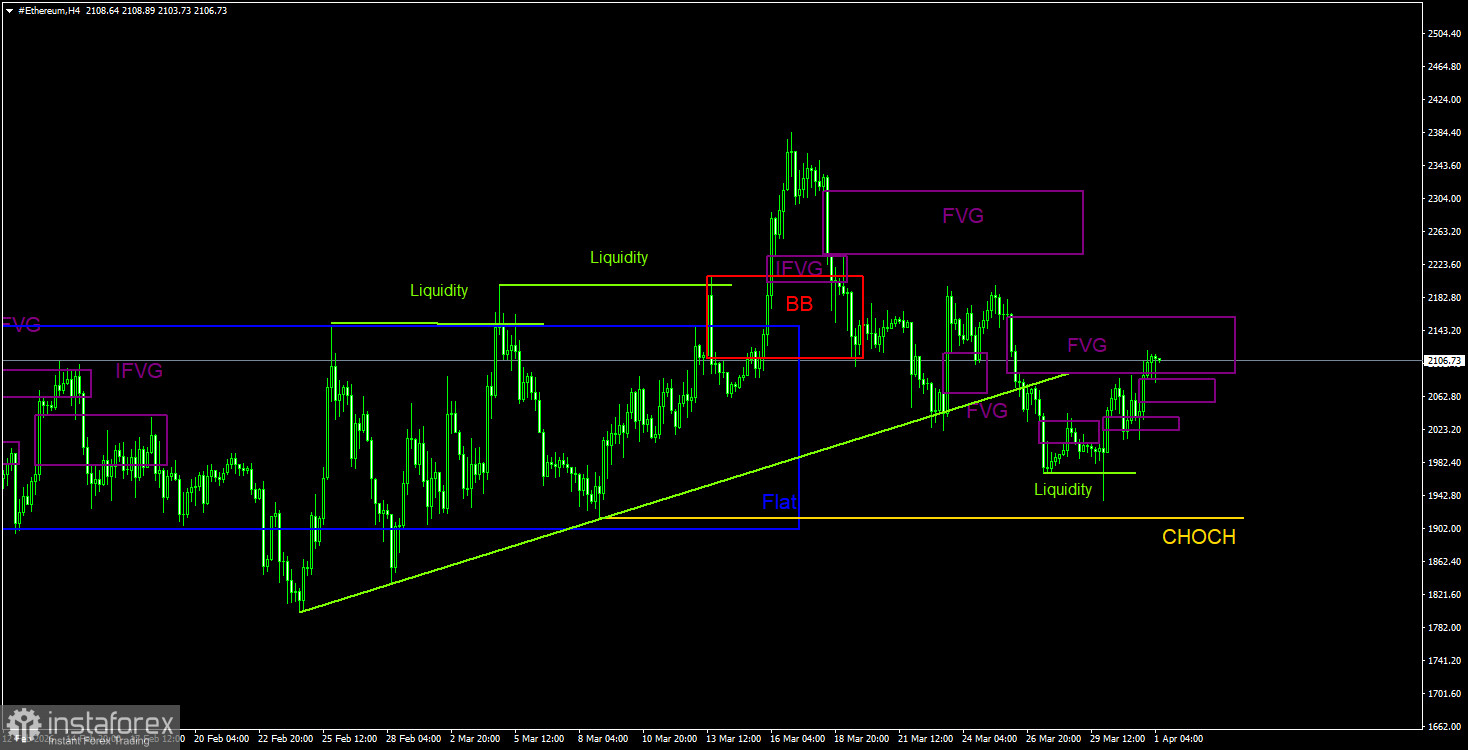
On the daily timeframe, the price remains in a downtrend, though its corrective bounce is still in progress. The key sell pattern was and remains the bearish order block on the weekly timeframe. As we warned, the move triggered by that signal can be strong and prolonged. After that pattern formed, Ethereum had already slumped about 55%, or roughly $2,500. In the near term, Ethereum may continue a weak upward correction. On the 4-hour timeframe, the crypto left the sideways channel, but a meaningful trend has not started yet. On the 4-hour chart, FVGs are forming in bunches, and on the daily chart, the price has not reached the nearest bearish pattern for a month and a half.
CHOCH — change of character / break of the trend structure. Liquidity — liquidity, traders' Stop?Losses that market makers use to build their positions. FVG — Fair Value Gap (area of price inefficiency). The price often moves quickly through such areas, indicating the absence of one side in the market. Later, the price tends to return and react to these zones. IFVG — Inverted Fair Value Gap. After a return to such a zone, the price does not react but impulsively breaks through and then tests it from the other side.
OB — Order Block. A candle on which a market?maker opened a position in order to harvest liquidity and then form their own position in the opposite direction.


