আরও দেখুন

 20.05.2026 09:29 AM
Bitcoin and Ethereum are finally showing signs that a three?month upward correction is ending. Liquidity pools are detected at lower levels, and prices are likely to revisit them with about 90% probability. Structural breaks, sell signals, and bearish patterns are already in progress. Thus, as before, we share a bearish outlook for the two main cryptocurrencies.
Meanwhile, new information has surfaced that helps explain Bitcoin's drop over the past week. Contrary to popular belief, institutional investors withdrew roughly $1 billion from Bitcoin ETFs. Spot demand remains weak, and long positions on futures are being closed as traders lack confidence in further upside. Besides, accelerating inflation in the US means that the Federal Reserve may return to tightening monetary policy before year?end. US central bank policy remains one of the key drivers of the crypto market: the higher the Fed rate, the more attractive bank deposits and Treasury yields become. US Treasury yields rose this week to 4.655%, so more investors are shifting focus to safe assets while appetite for risk falls.
Let me remind you that since 2022, when US inflation began to retreat from peak levels, the market expected Fed rate cuts, which helped fuel the bullish trend in 2022–2025. Before the Iran war, the market anticipated a gradual continuation of monetary easing, especially after Jerome Powell's departure and Kevin Warsh's arrival. But military aggression by Trump in Iran changed everything. The world is now in a state of global geopolitical uncertainty and learning to survive an energy crisis. In such conditions, investors do not want additional risk. The Federal Reserve is forced to adopt a more hawkish stance, which further reduces the likelihood of a new rally for "digital gold."
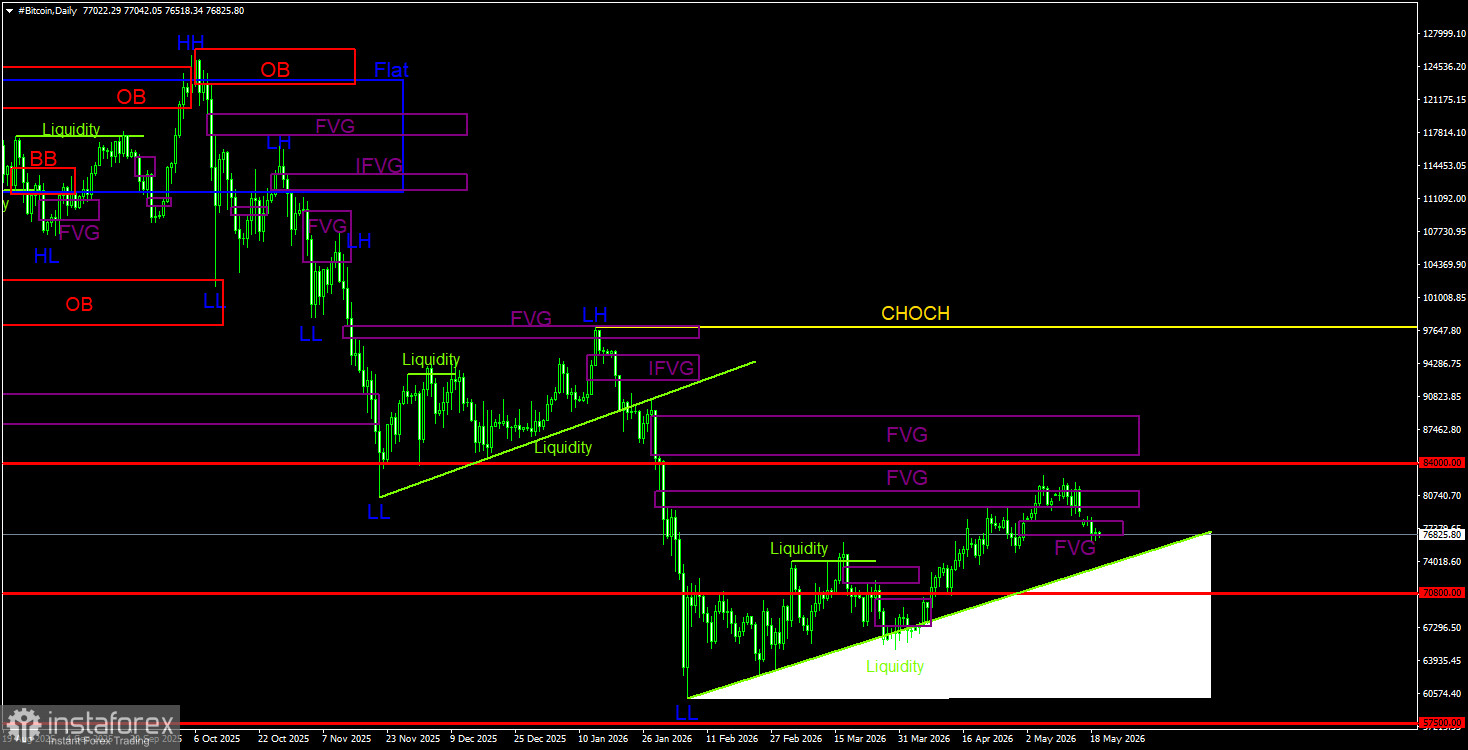
Bitcoin is continuing to form a full-fledged downtrend and a correction against it. We continue to expect a decline toward $57,500 (the 61.8% Fibonacci level of the three?year uptrend), and there are still no signs of the start of a long?term uptrend. Of the POIs (points of interest), the nearest bearish FVG (fair value gap) on the daily timeframe around $79,300–$81,200 is noteworthy. A sell signal was formed there (on the second attempt) and confirmed on the 1-hour chart. Therefore, in the near term, we are poised for a resumption of the downtrend, and bearish patterns on the 4?hour chart can be used to open new short positions for those who have not yet done so.
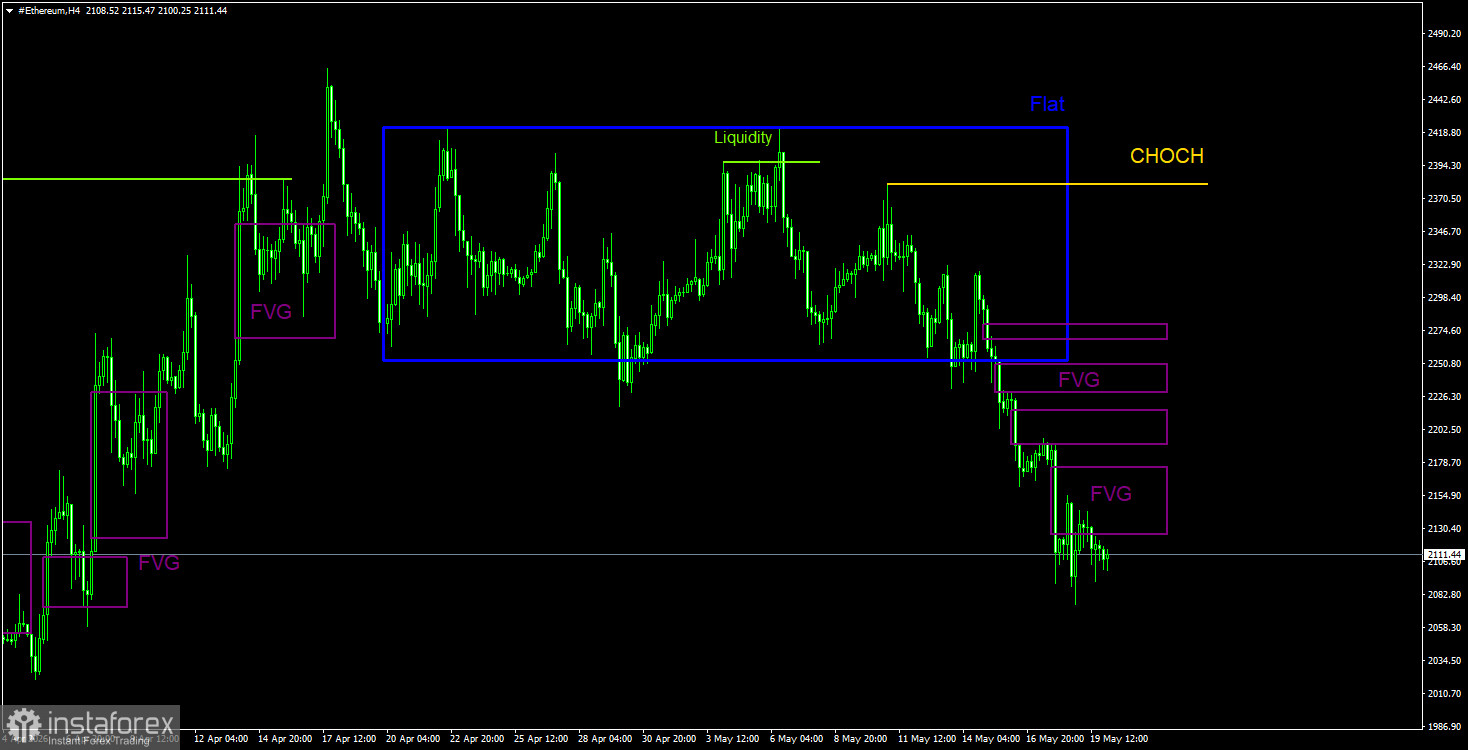
On the daily timeframe, a downtrend and a corrective move against it continue to form. The key sell pattern is the bearish order block on the weekly chart. As we warned, the move triggered by this signal can be strong and prolonged. We do not believe it is finished, since there are no signs of a completed downtrend for either Bitcoin or Ethereum. In the near term, Ethereum may continue to fall, as evidence of the end of the three?month correction grows by the day for both ETH and BTC. The 4?hour trend is bearish, so bearish patterns can be used to open short positions. The target remains $1,742.
CHOCH is a change of character / break of the trend structure. Liquidity is liquidity, traders' Stop?Losses that market?makers use to build their positions. FVG stands for Fair Value Gap (area of price inefficiency). The price often moves quickly through such areas, indicating the absence of one side in the market. Later, the price tends to return and react to these zones. IFVG means Inverted Fair Value Gap. After a return to such a zone, the price does not react but impulsively breaks through and then tests it from the other side.
OB is an Order Block. A candle on which a market?maker opened a position in order to harvest liquidity and then form their own position in the opposite direction.


