
আরও দেখুন


 24.08.2026 10:55 AM
On Friday, EUR/USD made a second rebound from the 127.2% retracement level at 1.1700 and reversed in favor of the US dollar. Thus, the decline may continue toward the next Fibonacci level of 100.0% at 1.1620. Consolidation above 1.1700 would favor the euro and a resumption of the upward movement toward the next retracement level of 161.8% at 1.1802.
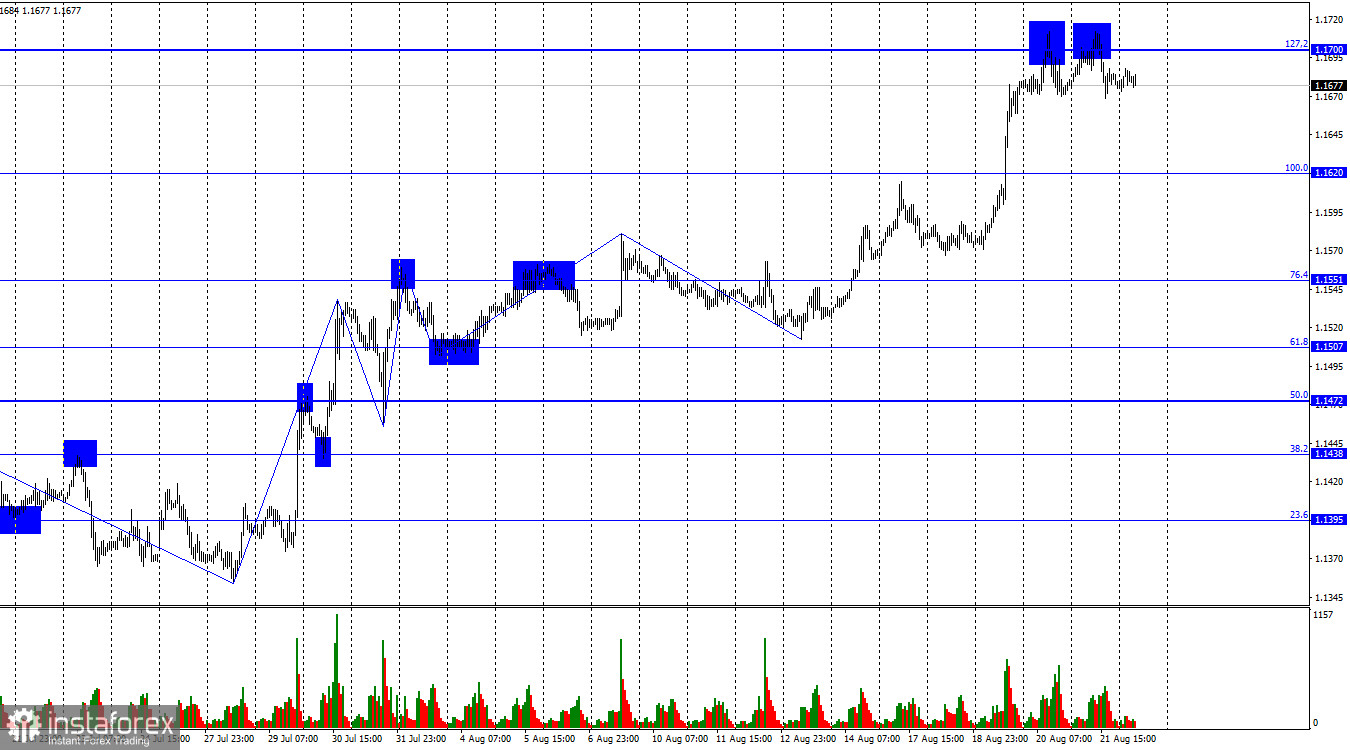
The wave structure on the hourly chart remains bullish. The latest completed downward wave did not break the previous low, while the new upward wave broke the previous high. The geopolitical backdrop remains consistently negative: negotiations between Iran and the United States are not taking place, and the blockade of the Strait of Hormuz remains in place. However, the FOMC's stance, which remains highly contradictory, is currently more important for the dollar.
The fundamental backdrop on Friday helped neither the dollar nor the euro. Purchasing Managers' Indices for August were released in the United States, Germany, and the European Union, but the European indices were insufficient to consolidate above 1.1700, while the US indexes were fairly mixed. At this point, I would focus on the key events of the current week. These include Kevin Warsh's speech, the annual revision of Nonfarm Payrolls, the second estimate of second-quarter GDP, and the report on durable goods orders. There will be enough news, although the most important releases will come only on Friday, while the market may ignore the others. There are currently too many important issues for traders to spread their attention across secondary events. This week, Donald Trump may begin a new escalation against Iran, but this time it may be economic rather than military. The US president believes that all countries doing business with Iran should stop doing so; otherwise, he threatens to impose crippling sanctions on them. In addition, Kevin Warsh's speech is crucial for assessing the outlook for FOMC monetary policy, while the US GDP report may come in even lower than in the previous estimate.
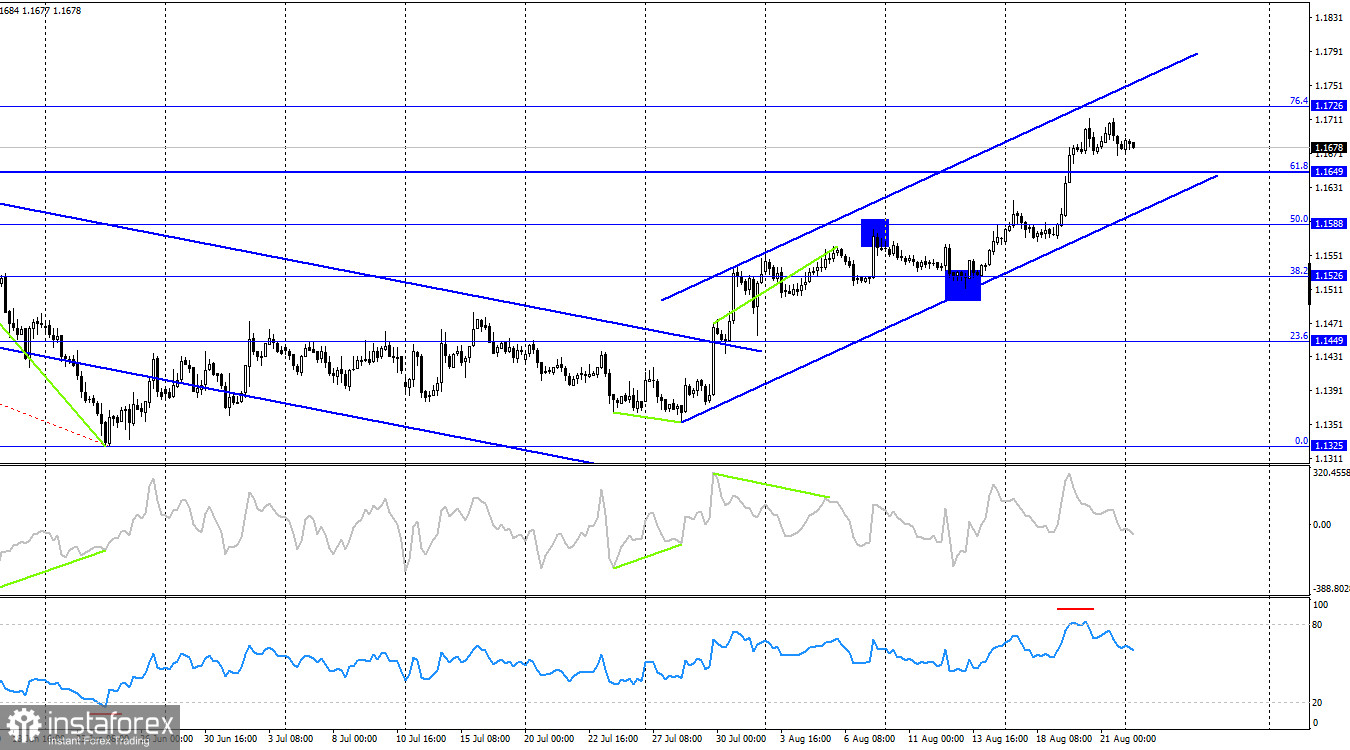
On the 4-hour chart, the pair continues to rise and has consolidated above the 61.8% retracement level at 1.1649. Thus, the euro's rise may continue toward the next Fibonacci level of 76.4% at 1.1726. The upward trend channel indicates a sustained bullish advance. A strengthening of the US dollar can now be expected no earlier than after the price closes below the channel. No developing divergences are currently observed, but the RSI indicator has entered overbought territory (above 80), which suggests that a corrective pullback may occur.
Commitments of Traders (COT) Report:
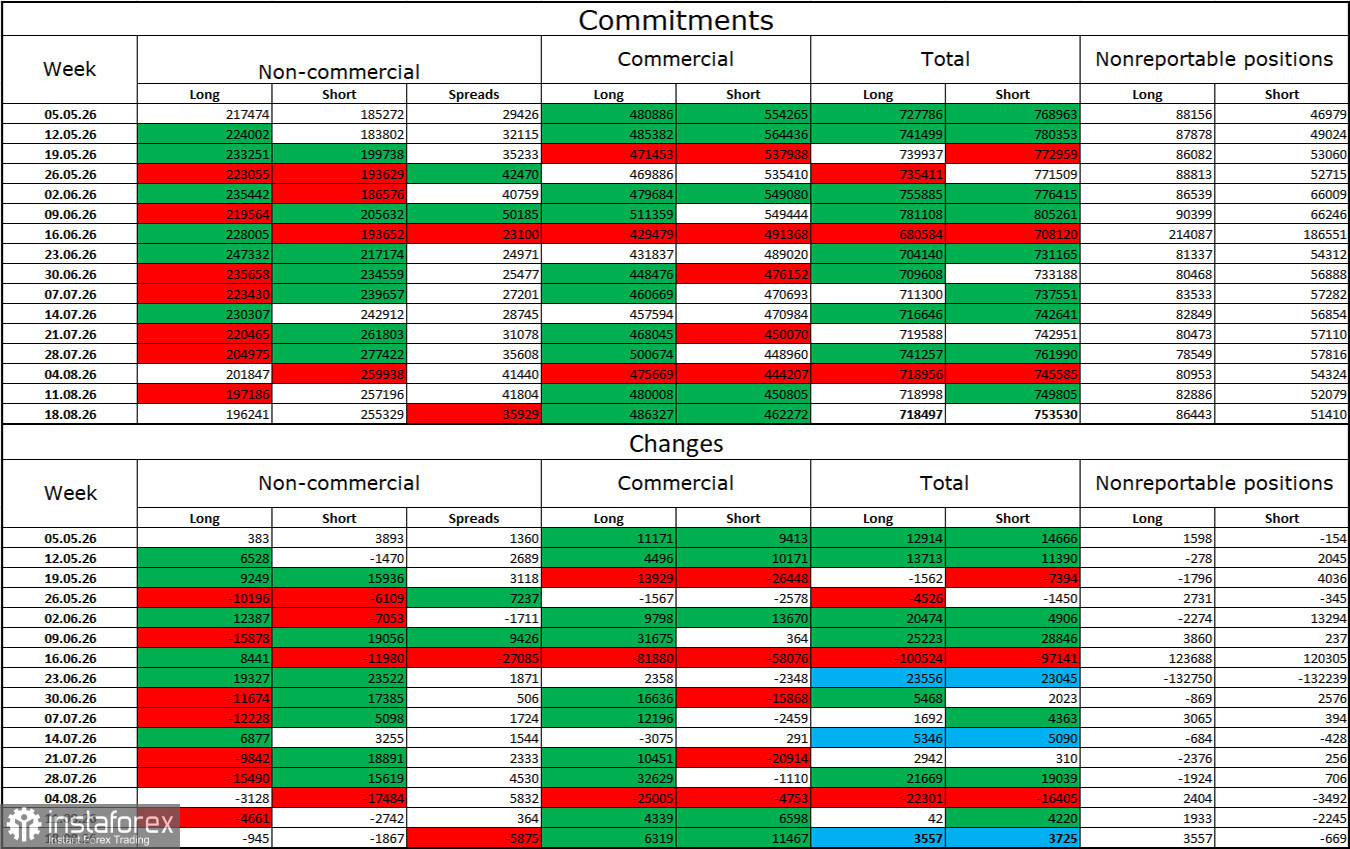
During the latest reporting week, professional traders closed 945 Long positions and 1,876 Short positions. Over the seven weeks in February and March, the bulls' overwhelming advantage evaporated because of the war in Iran, while over the past 21 weeks, the situation has become more balanced amid the supposed ceasefire and market hopes for an end to the war. The total number of Long positions held by speculators currently stands at 196,000, while the number of Short positions stands at 255,000. The bears are once again taking the lead.
Overall, over the long term, major market participants continue to show strong interest in the euro. Certainly, events of various kinds around the world, which have been abundant in recent years, affect investor sentiment. In particular, the market is currently keeping a close eye on the situation in the Middle East, where the war appears to end and then resumes again. The market initially ignored the ceasefire and then ignored the resumption of the war. Thus, geopolitics no longer determines the dollar's fate on its own.
News Calendar for the United States and the European Union:
On August 24, the economic calendar contains no events of particular interest. The economic backdrop will have no impact on market sentiment on Monday.
EUR/USD Forecast and Trading Advice:
Buy positions in the pair were possible after consolidation above 1.1620 on the hourly chart, with a target of 1.1700. The target was reached. A close above 1.1700 will allow traders to keep positions open with a target of 1.1786. Sell positions were possible after a rebound from 1.1700 on the hourly chart, with a target of 1.1620.
Fibonacci grids are drawn from 1.1620–1.1325 on the hourly chart and from 1.1849–1.1325 on the 4-hour chart.


