See also

 10.12.2025 05:57 AM
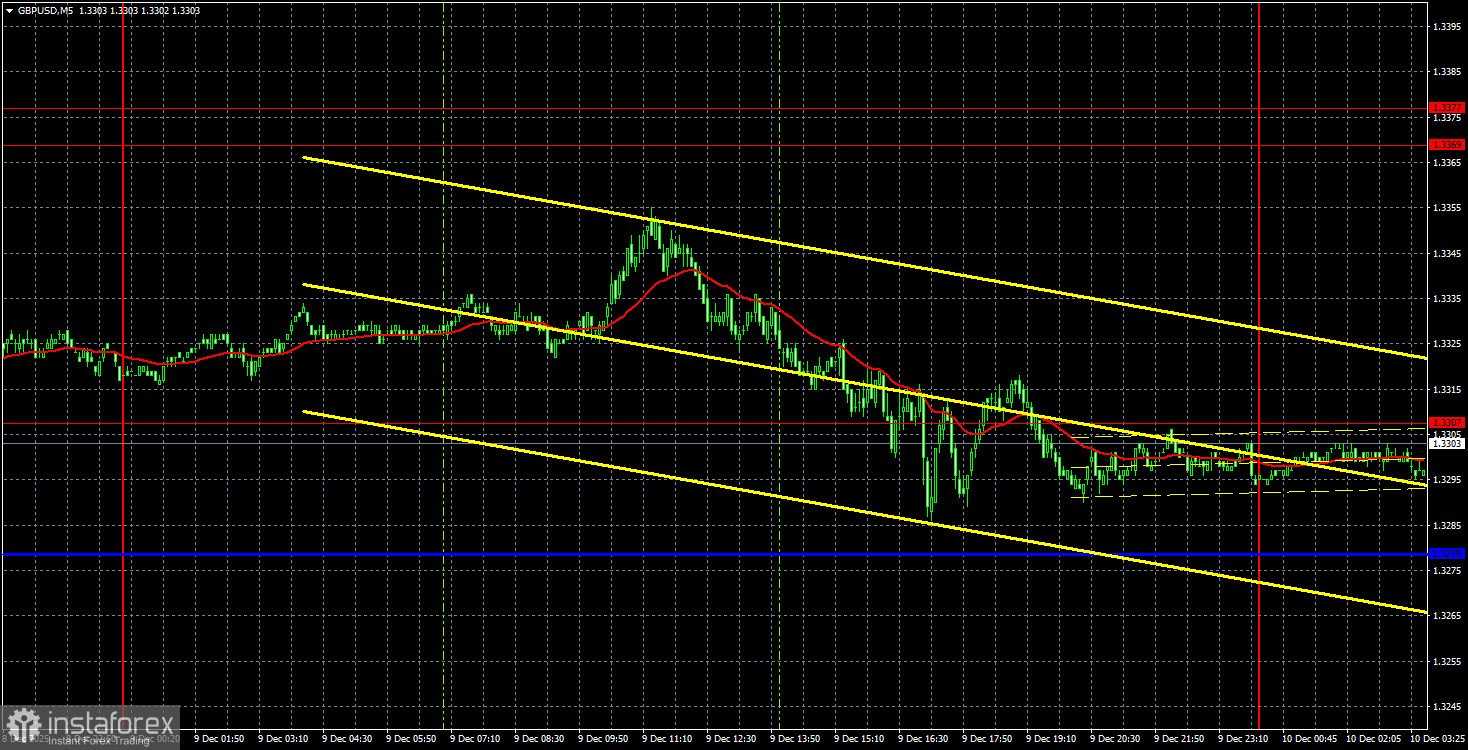
The GBP/USD currency pair continued its sluggish decline on Tuesday, similar to its "older sister" – the EUR/USD pair. In general, the British pound's positions currently appear more convincing than those of the European currency, and the technical picture is clearer. The British currency continues to trade above the trendline and the Kijun-sen line. Therefore, the upward trend is undoubtedly maintained. Of course, this evening it could easily turn into a downward trend if the market considers the results of the FOMC meeting to be "hawkish." It is difficult for us to say how a decrease in the key interest rate and the unconditionally "dovish" prospects for 2026 can be interpreted in a "hawkish" manner, but we remind you that the last two rounds of monetary policy easing by the FOMC have provoked... a strengthening of the US dollar. Therefore, anything is possible this evening.
On a technical level, we continue to consider the euro and the pound in tandem. On the daily timeframe, the European currency remains flat, suggesting the pound is unlikely to slide much further. The European currency has entered a new phase of growth within the sideways channel, suggesting the British pound could also continue its upward movement. In any case, it is not sensible to speak of a downward trend on the hourly timeframe until a settlement below the trend line and critical line occurs.
On the 5-minute timeframe, yesterday, signals formed similarly to those of the EUR/USD pair. The price settled below the level of 1.3307 during the U.S. trading session, but was it worth opening short positions when the critical line was located 30 pips lower?
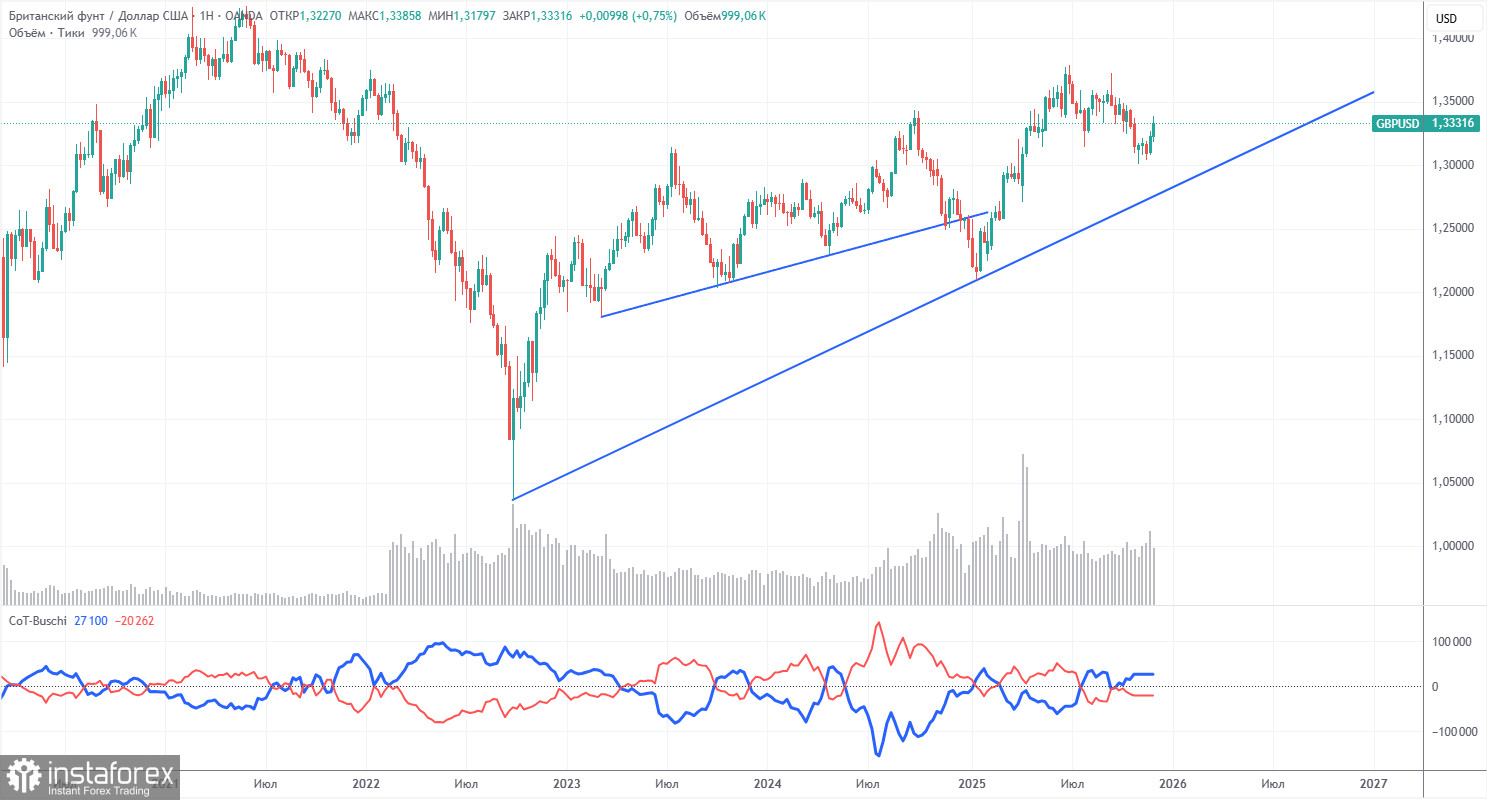
COT reports on the British pound show that in recent years, the mood of commercial traders has been constantly changing. The red and blue lines, which reflect the net positions of commercial and non-commercial traders, frequently cross and are mostly close to the zero mark. Right now, they are at practically the same level, indicating a roughly equal number of long and short positions.
The dollar continues to decline due to Donald Trump's policies, as is clearly visible on the weekly timeframe (illustration above). The trade war will continue in one form or another for a long time. The FOMC will, in any case, lower the rate in the next 12 months. Demand for the dollar will inevitably fall. According to the latest COT report (dated October 28) for the British pound, the "Non-commercial" group opened 7,000 BUY contracts and 10,500 SELL contracts. Thus, the net position of non-commercial traders decreased by 3,500 contracts over the week. However, this data is now outdated, and no fresh data is available.
In 2025, the pound rose significantly, but it should be understood that the reason is one: Donald Trump's policies. As soon as this reason is neutralized, the dollar may begin to appreciate, but no one knows when this will happen. It does not matter how rapidly the net position on the pound is growing or falling (if it is falling). For the dollar, it is declining in any case, and typically at a higher pace.
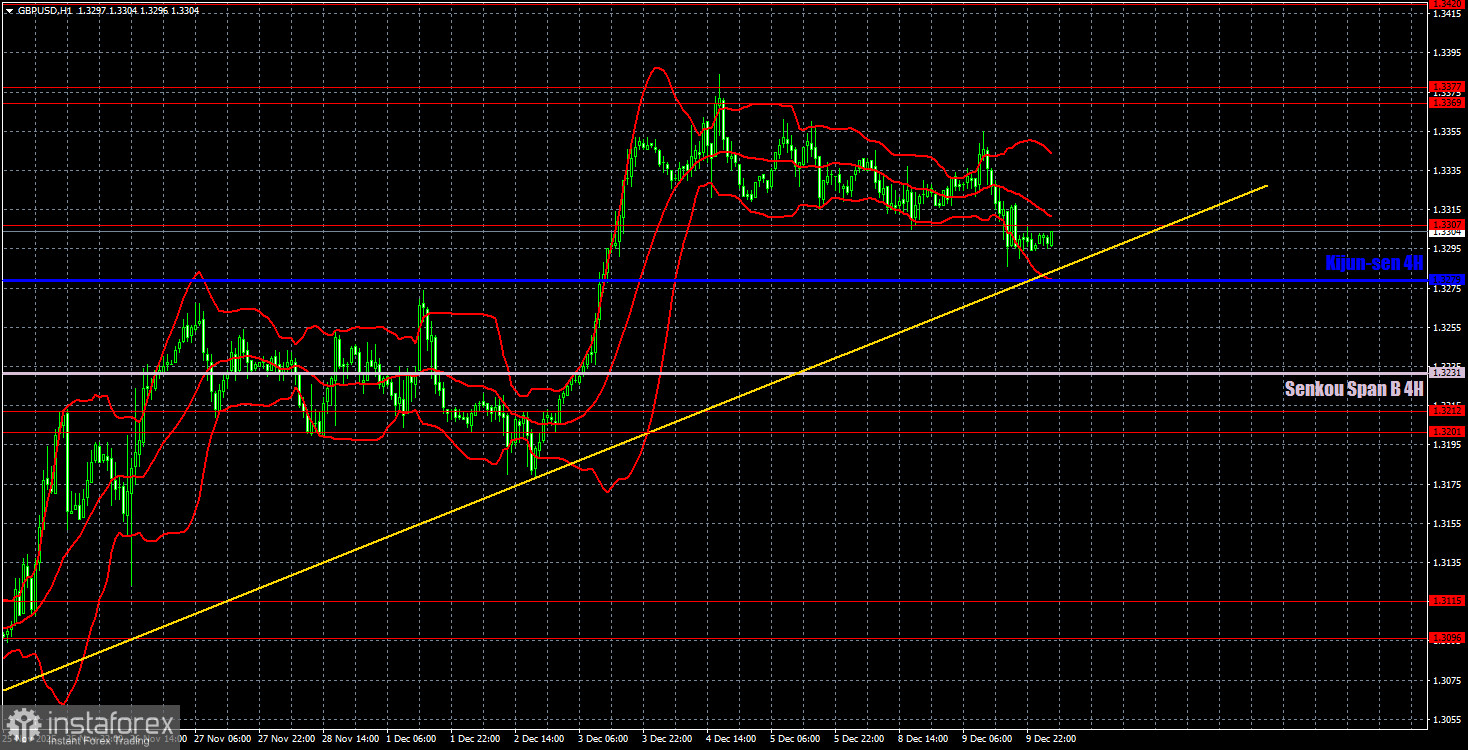
On the hourly timeframe, the GBP/USD pair continues to form an upward trend. We believe that medium-term growth will continue regardless of the local macroeconomic and fundamental backdrop, and that the correction on the daily timeframe will eventually conclude. Or has already concluded. However, in December, much will depend on US labor market data, unemployment, and inflation, which will determine the next vector of FOMC monetary policy.
For December 10, we highlight the following important levels: 1.2863, 1.2981-1.2987, 1.3042-1.3050, 1.3096-1.3115, 1.3201-1.3212, 1.3307, 1.3369-1.3377, 1.3420, 1.3533-1.3548, 1.3584. The Senkou Span B (1.3231) and Kijun-sen (1.3279) lines may also be sources of signals. It is recommended to set the Stop Loss level to break-even when the price moves in the correct direction by 20 pips. The lines of the Ichimoku indicator may shift throughout the day, which should be taken into account when determining trading signals.
On Wednesday, no interesting events or reports are scheduled in the UK, so all market attention will be focused on the evening FOMC meeting, Jerome Powell's speech, and the publication of the dot-plot economic projection graph. The dot-plot graph reflects the expectations of Monetary Committee members regarding interest rates for the next two years. Thus, this graph demonstrates changes in the FOMC's sentiment.
Today, traders may consider selling if the price settles below the Kijun-sen line again, targeting 1.3231. Long positions will become relevant if there is a bounce from the trend line or Kijun-sen line, targeting 1.3369-1.3377.


