See also

 13.04.2026 10:20 AM
On the hourly chart, the GBP/USD pair on Friday made a third rebound from the resistance level of 1.3437–1.3465, which again allows for expectations of a reversal in favor of the US dollar and some decline toward the support level of 1.3341–1.3352. I would also note that the 1.3437–1.3465 level represents the upper boundary of the sideways range 1.3177–1.3465. Thus, the pound has been moving horizontally for about a month and a half.
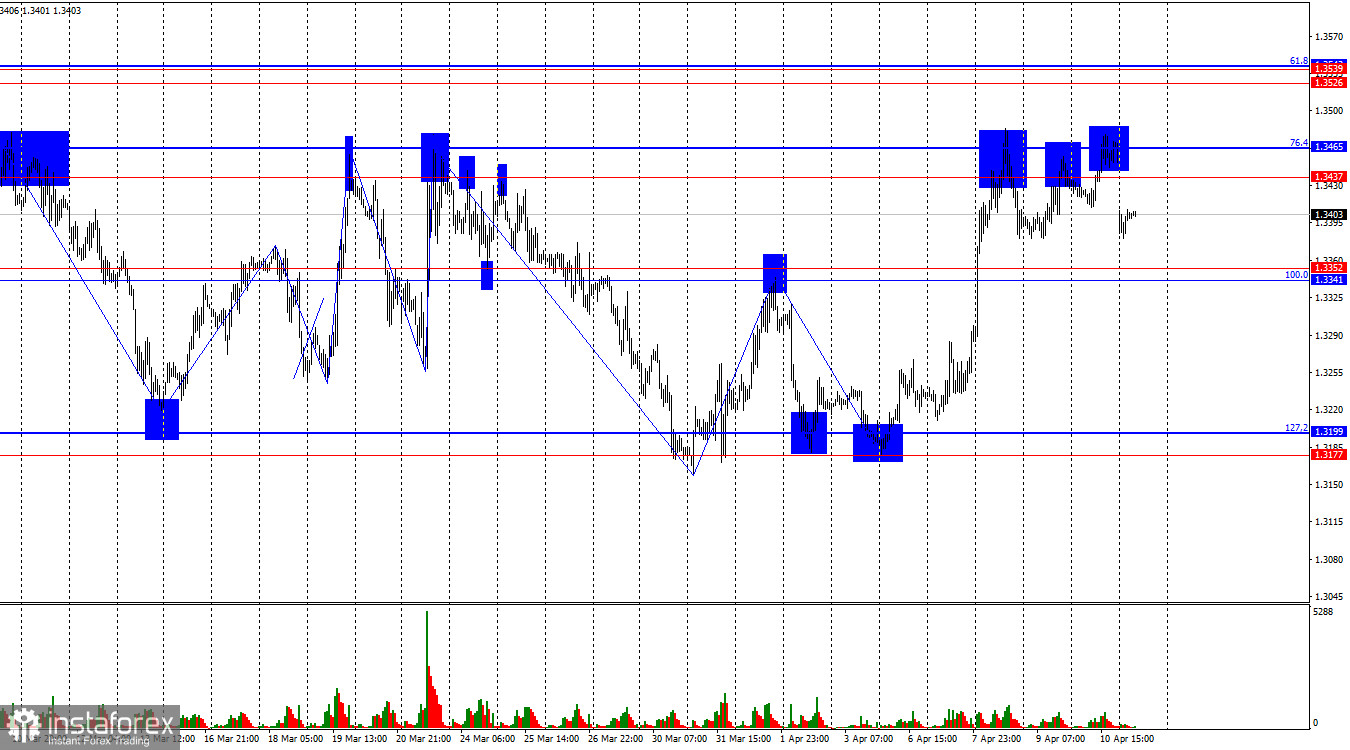
The wave situation has once again shifted to a "bullish" outlook. The latest upward wave broke the previous peak, while the last completed downward wave did not break the previous low. Geopolitics had provided bears with almost full dominance in the market for two months, then the geopolitical backdrop began to improve, which gave bulls more confidence. However, we can see that this is still not enough to break out of the sideways range between 1.3177 and 1.3465.
The news background on Friday can hardly be called positive for either bulls or bears. Inflation in the US rose to 3.3% in March, which could support bears, as the Federal Reserve may soon need to consider tightening monetary policy if it aims to keep inflation under control. However, at the same time, in about a month Jerome Powell will step down, and Kevin Warsh — considered aligned with Trump — will take his place. I strongly doubt that the new Fed chair will support monetary tightening.
Of course, interest rate decisions depend not only on the head of the FOMC. The committee itself may continue voting to maintain or even tighten policy. However, it is currently difficult to understand how the Fed will react to rising inflation, how strong inflation may become, how long the conflict in the Middle East will last, what will happen with oil prices if the Strait of Hormuz remains under dual blockade. Thus, for now, the key factor for me remains the horizontal range.
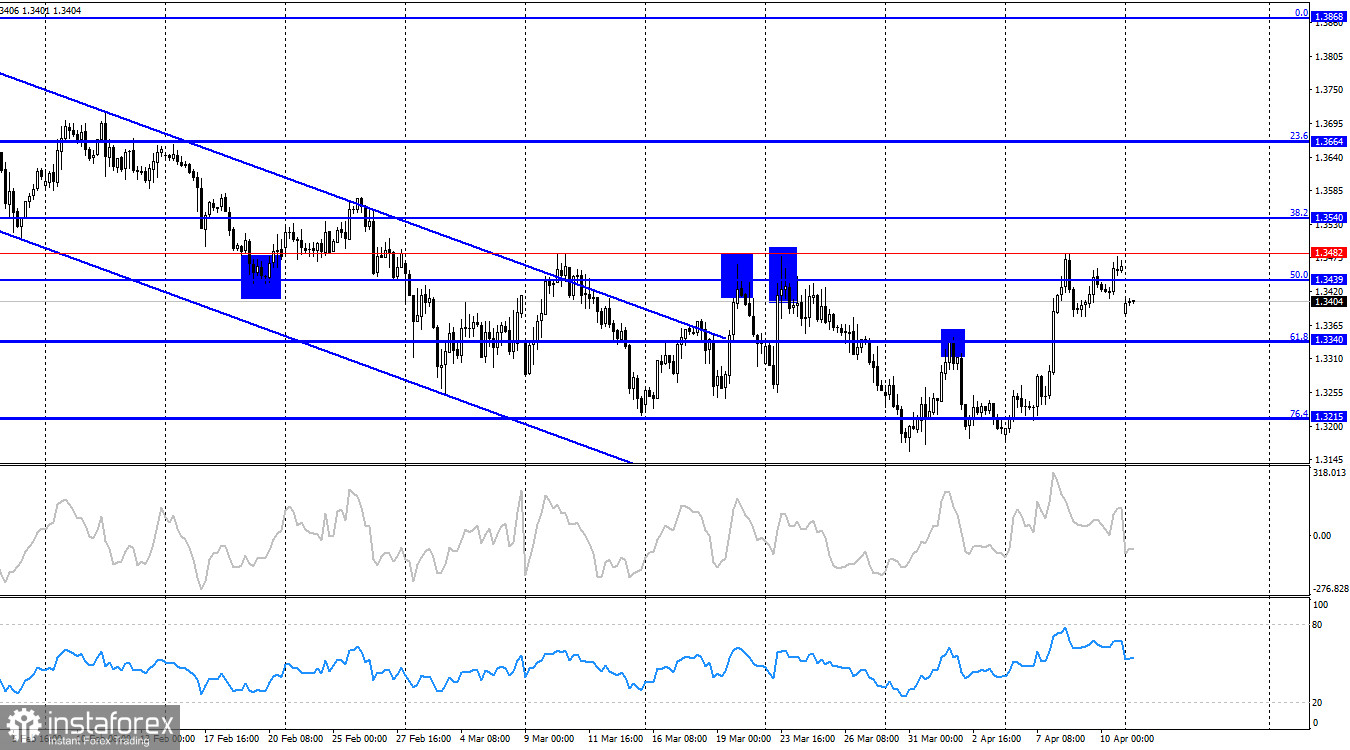
On the 4-hour chart, the pair managed to break above the descending trend channel, but this has not yet given bulls any real advantage. The pound has risen to the resistance level of 1.3439–1.3482 but cannot break through it. Geopolitics has improved somewhat, but not enough for bears to leave the market. A breakout above 1.3482 would increase the likelihood of further growth toward 1.3540 and 1.3664. No emerging divergences are currently observed on any indicators.
Commitments of Traders (COT) Report:
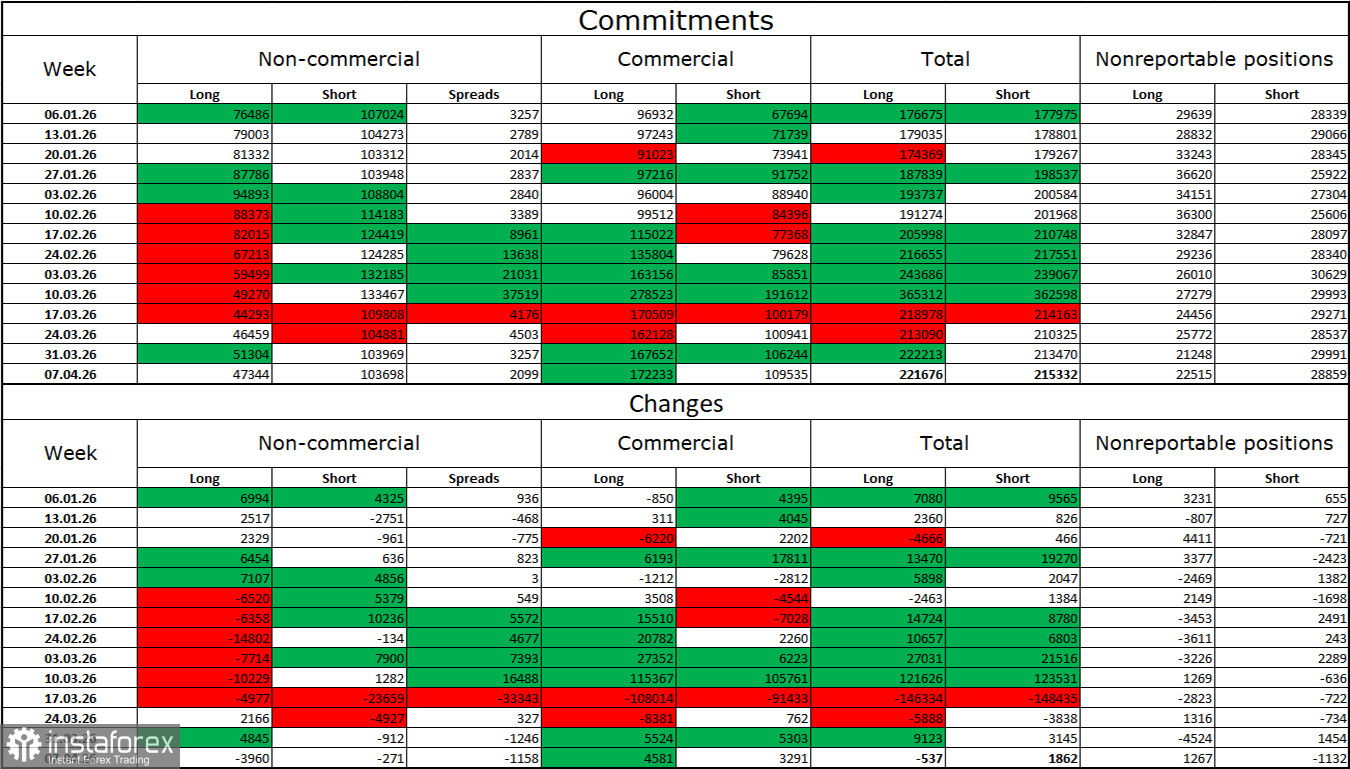
The sentiment of the "Non-commercial" trader category became more bearish over the last reporting week. The number of long positions held by speculators decreased by 3,960, while short positions decreased by 217. The gap between long and short positions now stands at approximately 47,000 versus 104,000.
For six consecutive weeks, non-commercial traders have been actively increasing short positions and reducing long ones, creating a significant imbalance. Bears have dominated in recent weeks, which is not surprising given the geopolitical situation.
I still do not believe in a sustained bearish trend for the pound, but now everything depends not on economic indicators, Trump's trade policy, or central bank monetary policy, but on the duration, scale, and consequences of the war in the Middle East. In recent months, we first saw a correction within a bullish trend, and then the conflict in the Middle East began escalating almost daily. Geopolitics remains the only reason for the strength of the US dollar.
News Calendar for the US and UK:
On April 13, the economic calendar contains only one minor entry. The information background is unlikely to influence market sentiment on Monday. Traders continue to focus mainly on geopolitical developments.
GBP/USD Forecast and Trading Tips:
Sell positions were possible after a rebound from the 1.3437–1.3465 level on the hourly chart, targeting 1.3341–1.3352. These trades can still be held open today. Buy positions may become possible after a rebound from the 1.3341–1.3352 level, targeting 1.3437–1.3465. Alternatively, after a breakout above 1.3437–1.3465, with a target of 1.3526–1.3539.
Fibonacci levels are built from 1.3341–1.3866 on the hourly chart and from 1.3012–1.3868 on the 4-hour chart.


