
See also


 27.07.2026 04:47 AM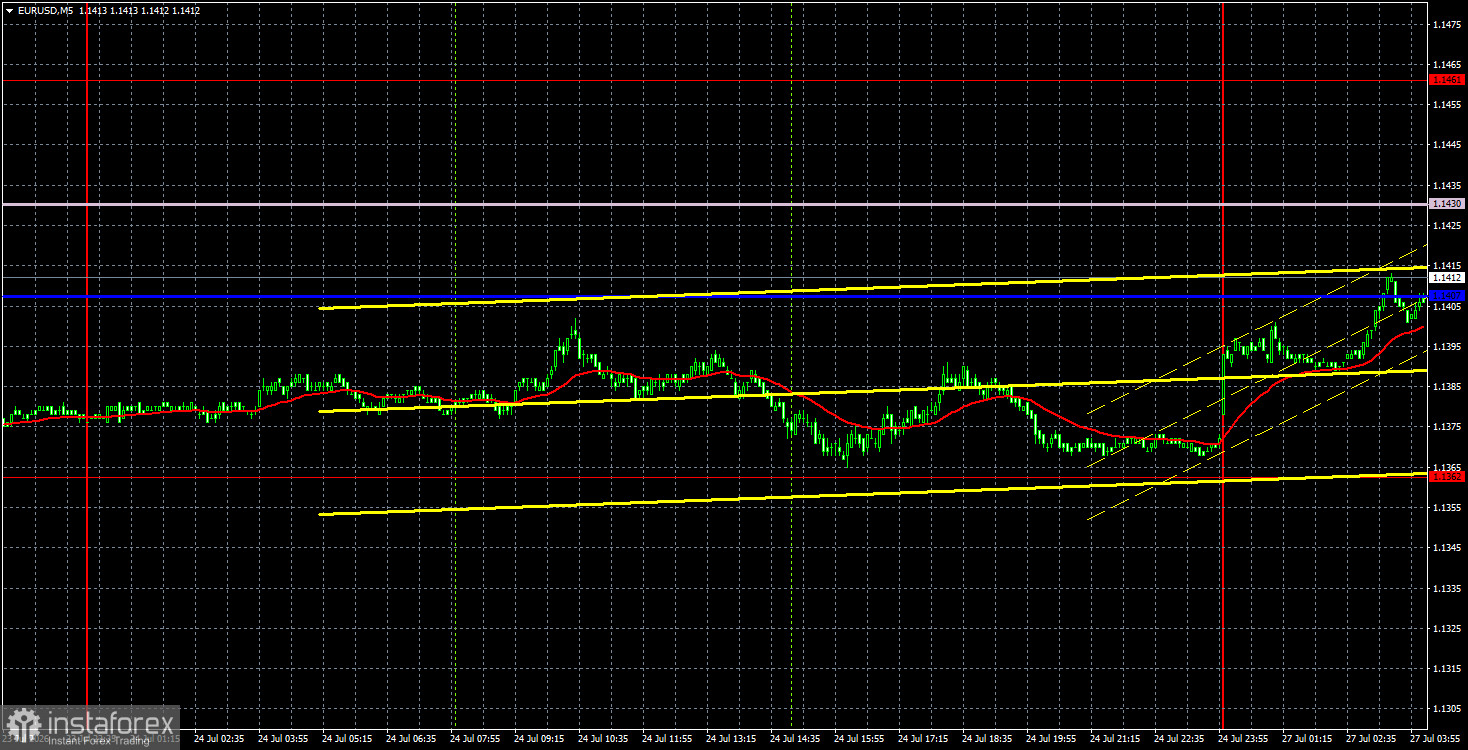
The EUR/USD pair continued to trade with minimal volatility and mostly sideways on Friday. The market continued to ignore all factors in favor of the euro. Certainly, the business activity indexes cannot be considered super-important indicators that the market is obliged to react to. However, the four most significant reports (on business activity in the services and manufacturing sectors of the EU and Germany) showed values higher than forecasts, which did not help the euro at all. Thus, the euro remains at the bottom, within the sideways channel of 1.1362-1.1461. Despite the euro falling for a whole week, its decline was no more than 100 pips, which was insufficient for a breakout from the flat. Over the weekend, it became known that Washington had halted strikes on Iranian territory. Donald Trump explained that he wanted to give Iran another chance at negotiations. Therefore, diplomacy may resume soon if Tehran itself wants to return to talks with the US. The dollar slightly fell at market open on Monday, but not critically.
From a technical perspective, the pair maintains minimal bullish momentum, but it has effectively been flat for a month. As the price approached the lower boundary of the channel, it was reasonable to expect either the end of the flat or a rebound and a new move toward the upper boundary at 1.1461. So far, we see the implementation of the second option.
On the 5-minute timeframe, no trading signals formed on Friday, although during the American session the price almost tested 1.1362. Formally, the price tested this level twice but without exact contact. Now we can expect movement toward the upper boundary of the channel.
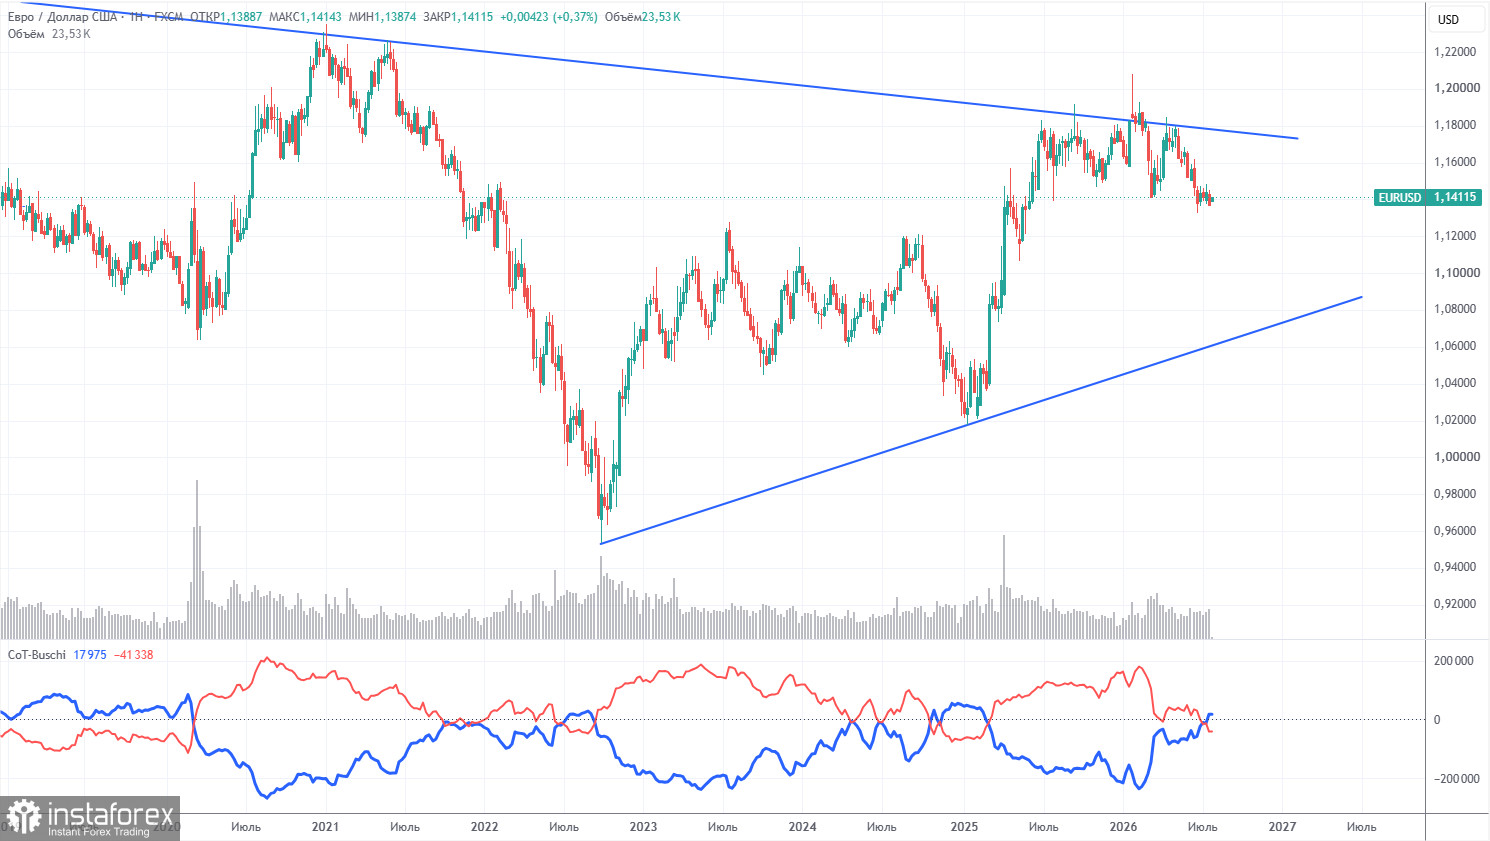
The latest COT report is dated July 21. The illustration of the weekly timeframe clearly shows that the net position of non-commercial traders has become bearish and significantly decreased due to geopolitical events. Traders have been shedding the euro in favor of the US dollar in recent months. Trump's policies have not changed, but the dollar has served as a "reserve currency" for some time.
We still do not see any fundamental factors for strengthening the euro, while there remain sufficient factors for a decline in the US dollar. The war in the Middle East has made the dollar temporarily very attractive, but when this factor's "shelf life" expires, everything will revert to its previous state. In the long term, the euro could fall to the level of $1.08 (the trend line), but the upward trend will remain relevant. Over the past months of dollar growth, the pair has not come significantly closer to this line.
The positioning of the red and blue lines of the indicator indicates parity between bulls and bears. Over the last reporting week, the number of long positions for the "Non-commercial" group decreased by 9,800, while the number of shorts increased by 18,900. Consequently, the net position fell by 28,700 contracts over the week.
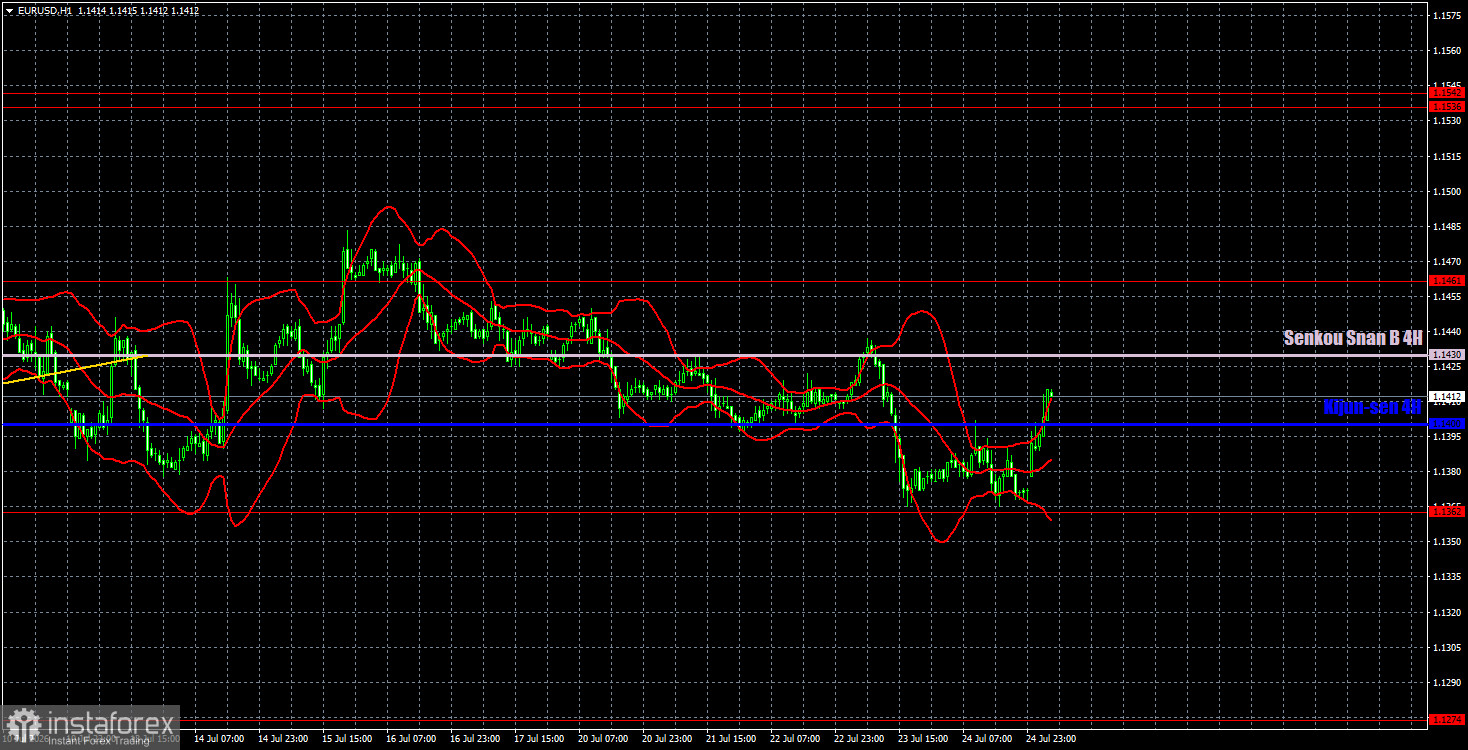
On the hourly timeframe, a corrective upward trend continues to form, which is essentially a flat. The situation in the Middle East remains tense and is not improving. The market continues to ignore many favorable factors for the euro, which is why the euro cannot demonstrate any growth. The European Central Bank meeting and the central bank's hawkish stance have been ignored for the second consecutive time.
On July 27, we highlight the following levels for trading: 1.1234, 1.1274, 1.1362, 1.1461, 1.1536-1.1542, 1.1585, 1.1657-1.1666, 1.1750-1.1760, 1.1786, 1.1830-1.1837, as well as the lines of Senkou Span B (1.1430) and Kijun-sen (1.1400). The lines of the Ichimoku indicator may move during the day, which should be considered when determining trading signals. Don't forget to set a Stop Loss at breakeven if the price moves in the correct direction by 15 pips. This will safeguard against potential losses if the signal turns out to be false.
On Monday, a relatively minor business climate index will be released in Germany, while the US will also publish a less significant report on durable goods orders. These reports are unlikely to influence market sentiment, which continues to await resolution regarding the situation in the Middle East.
Today, traders may consider short positions targeting 1.1274 if the price consolidates below 1.1362. Long positions are relevant after two price reversals near the lower boundary of the flat, targeting 1.1430 and 1.1461. Movements in the market may again be weak today.
Support and resistance price levels are thick red lines around which movement may end. They are not sources of trading signals.
The Kijun-sen and Senkou Span B lines are Ichimoku indicator lines transferred to the hourly timeframe from the 4-hour timeframe. They are considered strong lines.
Extreme levels are thin red lines from which the price has previously bounced. They serve as sources of trading signals.
Yellow lines indicate trend lines, trend channels, and any other technical patterns.
Indicator 1 on the COT charts shows the size of the net position for each category of traders.


