
See also


 07.09.2026 02:07 AM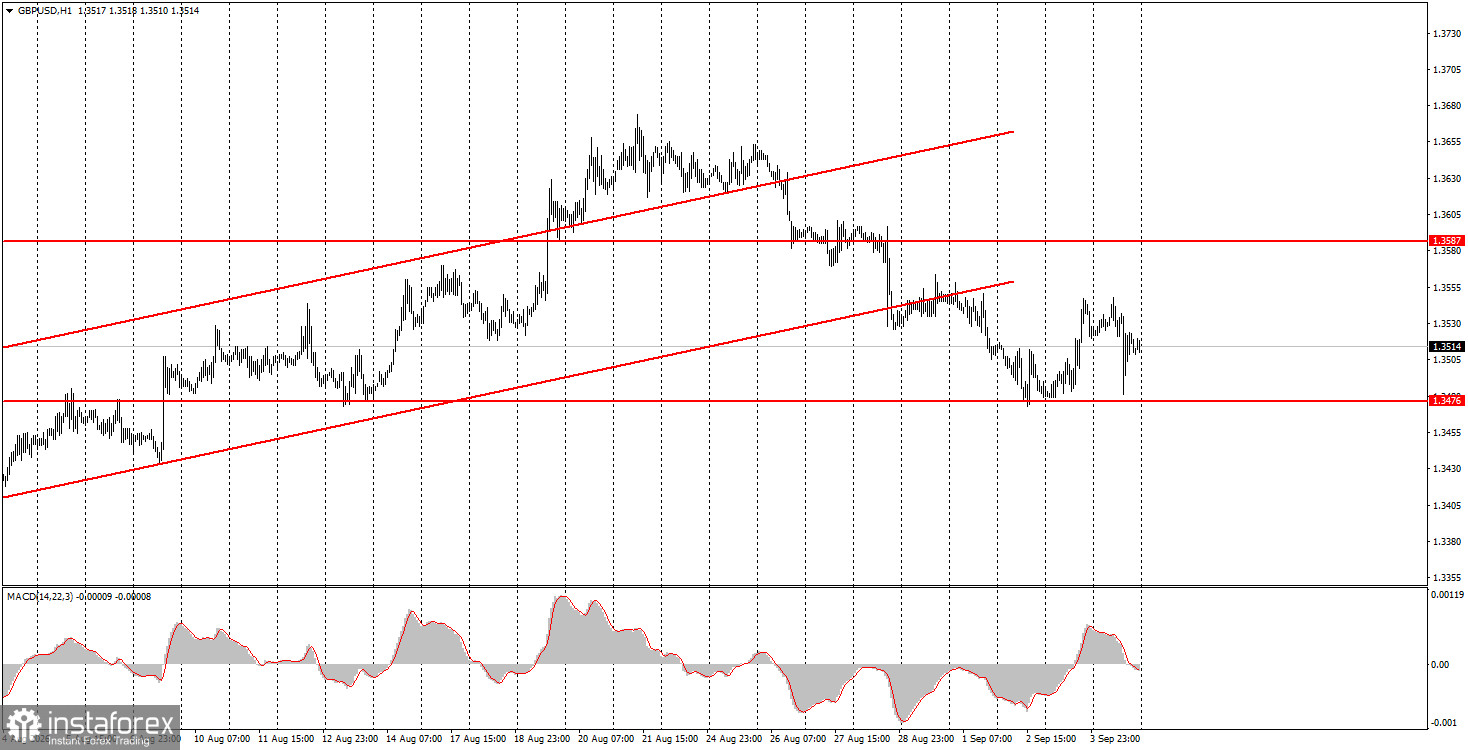
The GBP/USD pair also showed movements on Friday that traders could not reasonably expect. The situation is simple. If the Nonfarm Payrolls report prints a strong reading (above forecasts), one would expect a powerful rise in the US dollar. If the Nonfarm report prints weak numbers, one would expect the dollar to fall. In the end, we saw neither. The NFP value was three times higher than the most optimistic forecasts, yet the dollar gained only about 50 pips and lost most of that by the end of the day. In essence, the dollar did not rally when it had every reason to, and the market reaction to this major report was weak. The main point is that the market has not yet resolved whether the August NFP will prompt the Federal Reserve to raise rates in September. On the one hand, the report was strong; on the other hand, it is only one data point.
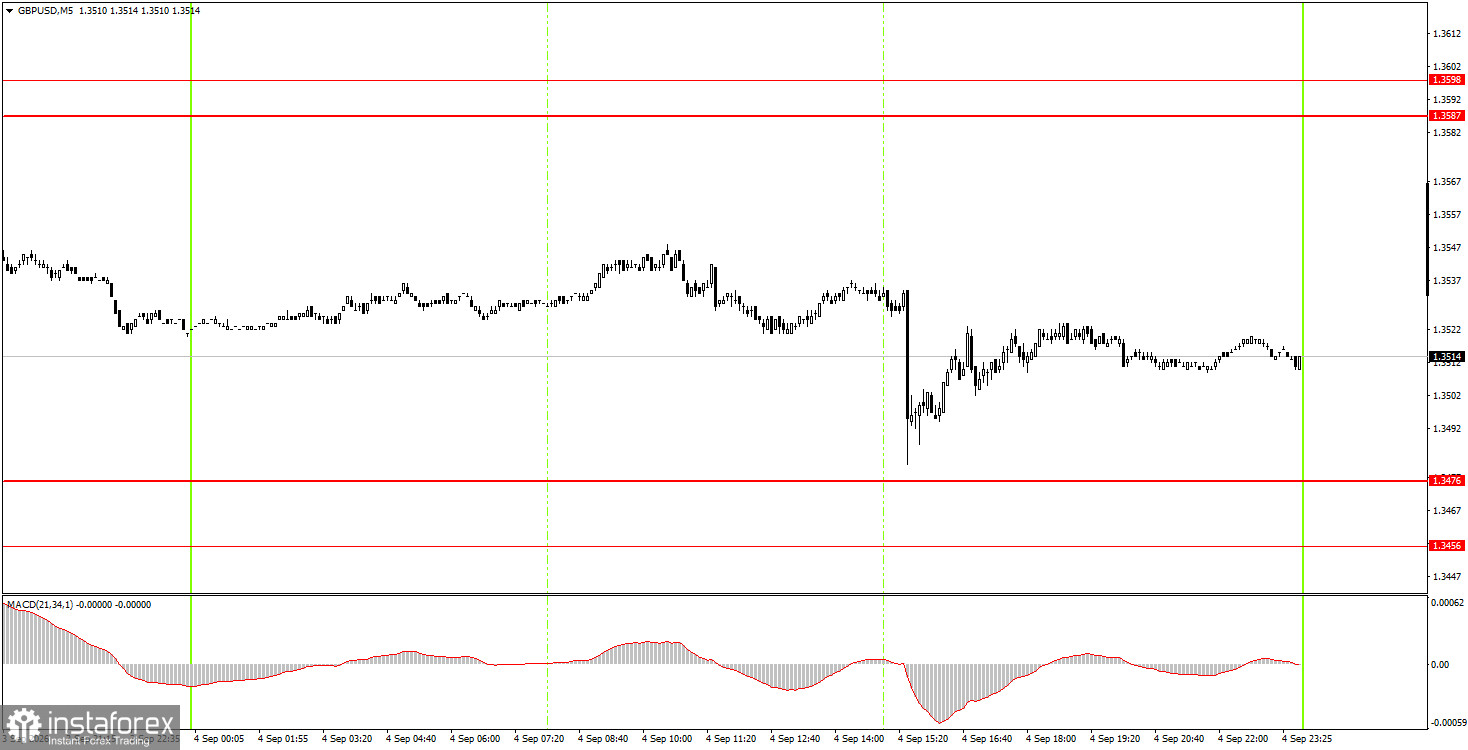
On the 5-minute TF on Friday, no trading signals were generated. During the US session, the pair could have reached the 1.3456–1.3476 area after the US data release but missed by about 5 pips. Therefore, there were no grounds for novice traders to open trades.
On the hourly TF, the GBP/USD pair continues a downward corrective trend. In our view, the pound should continue to rise in the medium term under any scenario, but right now it remains in correction. On the weekly TF, the move from the lower boundary of the lateral channel toward the upper boundary continues and may not yet be complete. Therefore, we expect a resumption of the upward impulse.
On Monday, novice traders may consider short positions targeting 1.3380–1.3386 if price holds below the 1.3456–1.3476 area. Long positions can be opened with targets of 1.3587–1.3598 in the event of a bounce from the 1.3456–1.3476 area.
On the 5-minute TF, you can trade the levels 1.3259–1.3267, 1.3319–1.3331, 1.3380–1.3386, 1.3456–1.3476, 1.3587–1.3598, 1.3631–1.3641, 1.3695, 1.3741. No major events or publications are scheduled in the US or the UK on Monday. Therefore, we do not expect strong movements on the first trading day of the new week.
Price levels (areas) of support and resistance are levels that serve as targets when opening buy or sell trades, or as sources of signals.
Red lines indicate channels or trend lines that illustrate the current trend and show the preferred direction for trading.
The MACD indicator (14,22,3) — the histogram and signal line — is an auxiliary indicator that can also be used as a source of signals.
Important speeches and reports (contained in the news calendar) can significantly influence the movement of currency pairs. Therefore, during their release, trading should be approached with utmost caution, or traders should exit the market to avoid sudden reversals against the preceding movement.
Beginner forex traders should remember that not every trade can be profitable. Developing a clear strategy and practicing money management are key to long-term success in trading.


